S&P 500 Hits 5,215 Amid Rate Cut Hopes, Geopolitical Tensions Limit Gains
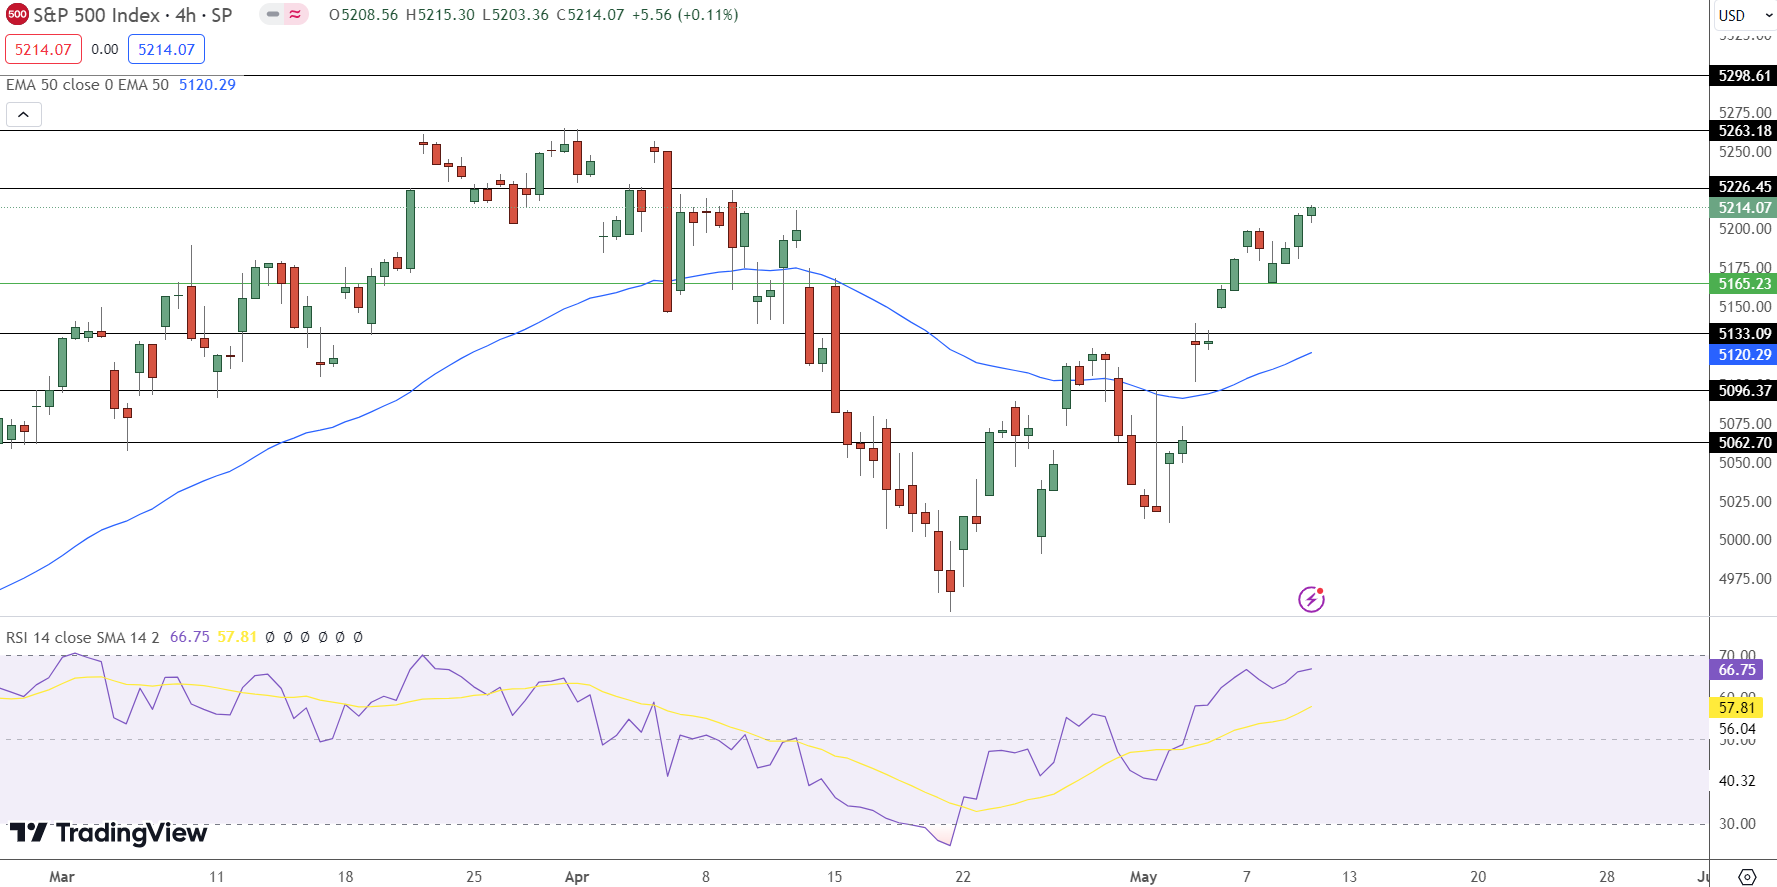
The S&P 500 price forecast remains optimistic, registering a substantial uptick to close at 5,214.07, up by 0.5%. The index peaked
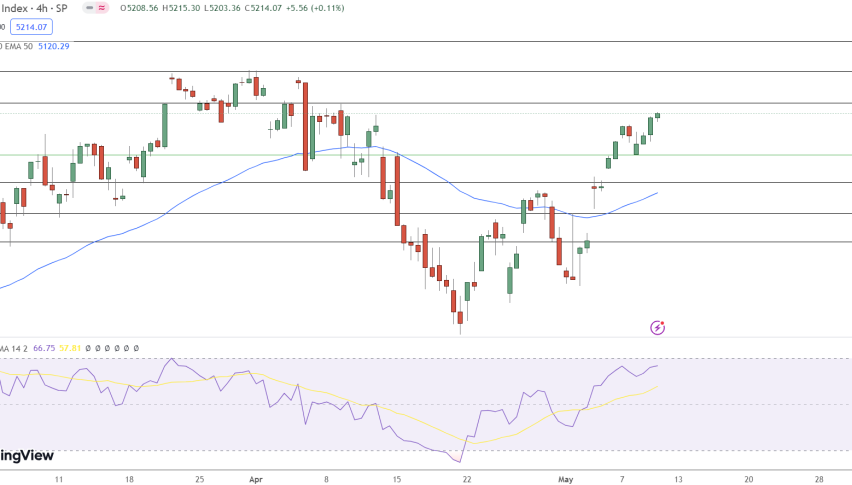
The S&P 500 price forecast remains optimistic, registering a substantial uptick to close at 5,214.07, up by 0.5%. The index peaked at an intra-day high of 5,215.30, propelled by investor optimism over potential Federal Reserve interest rate cuts.
Impact of Anticipated Fed Rate Cuts:
Expectations of an earlier-than-anticipated rate cut by the Federal Reserve have fueled investor optimism. This sentiment was bolstered by disappointing job market data, suggesting the U.S. economy is grappling with the impacts of high interest rates.
Initial jobless claims in early May and April’s Nonfarm Payrolls both indicated economic strains, prompting speculation about rate reductions to stimulate growth.
Geopolitical Uncertainty Caps Gains:
Despite the bullish trend, geopolitical tensions have moderated gains. The breakdown of peace talks between Hamas and Israel, along with heightened military activities around Gaza, have injected a dose of caution into the market.
This backdrop of instability could sway investor sentiment and influence market volatility in the near term.
Technical Outlook and Trading Strategy:
The S&P 500 is navigating through a positive trajectory, buoyed above the key support level at $5,143.95. Immediate resistance lies at $5,222.72, with potential to test higher levels at $5,265.20 and $5,303.26 should bullish momentum continue.
Conversely, support levels are established at $5,143.95 and $5,103.24, which could play pivotal roles in buffering any pullbacks. With the Relative Strength Index (RSI) nearing 70, indicating potential overbought conditions, traders might anticipate a consolidation or slight correction shortly.
Investors could consider a long position if the S&P 500 surpasses $5,200, targeting profits around $5,255 while placing a stop loss at $5,160 to manage risks effectively.
This analysis integrates recent economic data and geopolitical events, providing a comprehensive view of potential movements in the S&P 500 index and strategies for navigating the market effectively.
- Check out our free forex signals
- Follow the top economic events on FX Leaders economic calendar
- Trade better, discover more Forex Trading Strategies
- Open a FREE Trading Account
- Read our latest reviews on: Avatrade, Exness, HFM and XM
Related Articles


Sidebar rates
Related Posts
