Gold Price Drops to $2360 Amid Fed Speculation; More Sell-off Ahead?
This Monday, the gold price (XAU/USD) has shown a cooling off from recent gains during the Asian trading session. Triggered by assertive

This Monday, the gold price (XAU/USD) has shown a cooling off from recent gains during the Asian trading session. Triggered by assertive commentary from Federal Reserve officials and rising speculations that the Fed may postpone its monetary easing, the U.S. Dollar has strengthened, consequently pressuring the USD-denominated gold price downwards.
However, prevailing economic vulnerabilities and ongoing geopolitical conflicts in the Middle East may bolster the appeal of gold as a haven.
Impact of Fed Officials’ Statements on Gold
Today, the market is attentively awaiting speeches from Fed officials Jefferson and Mester, which could offer further cues on the monetary policy direction.
The unfolding week is also packed with significant U.S. economic releases including the Consumer Price Index (CPI), Producer Price Index (PPI), and Retail Sales data.
Outcomes surpassing expectations might reduce expectations for imminent Fed rate cuts, potentially applying downward pressure on the XAU/USD.
Economic Data and Geopolitical Tensions to Guide XAU/USD
Gold traders are also parsing through various Fed perspectives, with San Francisco Fed President Mary Daly advocating for a continued restrictive policy to meet inflation targets, while others like Atlanta Fed President Raphael Bostic hint at possible rate cuts within the year despite an unclear economic forecast.
This dichotomy in Fed communications adds a layer of complexity to the market’s expectations.
In addition to domestic factors, international events are also influencing gold prices. Military operations in Gaza by the Israeli forces and rising inflation expectations in the U.S., as reflected by the latest University of Michigan surveys, are crucial developments that could sway gold’s trajectory in the near term.
Gold Price Forecast: Technical Outlook
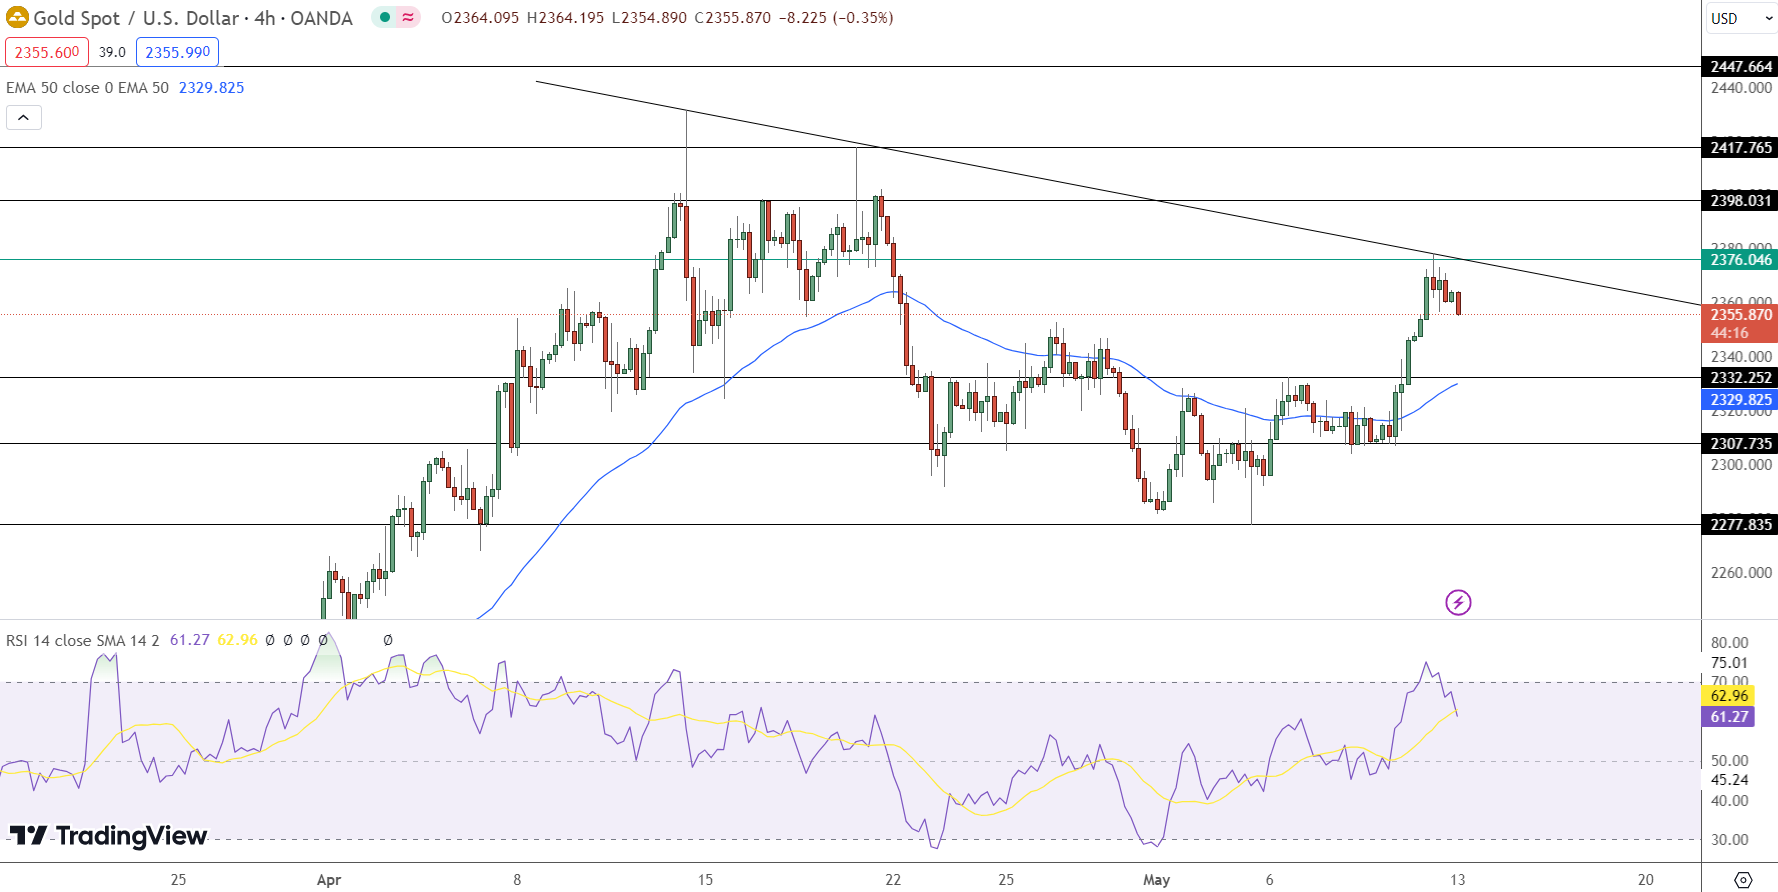
Today, gold is trading at $2360.515, showing slight fluctuations within a tightly bound range. The precious metal’s pivot point stands at $2376.05, suggesting that gold faces immediate resistance at $2396.42, followed by $2412.30 and $2425.37.
These resistance levels will need to be breached for gold to maintain upward momentum. Conversely, gold finds immediate support at $2349.42, with further downside barriers at $2332.96 and $2320.47, which could be tested if the price retreats.
The Relative Strength Index (RSI) is currently at 62, indicating a generally bullish sentiment, but not yet overextended. The 50-day Exponential Moving Average (EMA) at $2334.35 serves as a support level, reinforcing a potential bullish trend if prices hold above this mark.
In summary, while gold displays a potential for bullish behaviour above $2360, a drop below this level could shift the outlook to bearish.
- Check out our free forex signals
- Follow the top economic events on FX Leaders economic calendar
- Trade better, discover more Forex Trading Strategies
- Open a FREE Trading Account
- Read our latest reviews on: Avatrade, Exness, HFM and XM
Related Articles


Sidebar rates
Related Posts
