Gold Price Forecast: XAU/USD Up 0.34% to $2338.90, U.S. Inflation Data Ahead
Gold (XAU/USD) prices modestly increased in Asian trading on Tuesday, recovering from a 1.5% decline seen in the previous session, reaching

Gold (XAU/USD) prices modestly increased in Asian trading on Tuesday, recovering from a 1.5% decline seen in the previous session, reaching $2,343.60 per ounce.
This slight recovery occurs ahead of crucial U.S. inflation data releases, which are expected to provide vital insights into future interest rate policies. The April Producer Price Index (PPI) is expected to show a 2.2% year-over-year rise, while Core PPI is forecast to increase by 2.4%.
The Consumer Price Index (CPI) is anticipated to ease to 3.4% year-over-year from 3.5% in March, with Core CPI projected to decrease to 3.6% from 3.8%. Ongoing geopolitical tensions in the Middle East have temporarily increased the demand for gold as a haven.
Actions by Israeli forces in Gaza and heightened tensions with Hamas have contributed to this trend. However, a potential de-escalation, particularly between Iran and Israel, may reduce this demand and expose gold to the pressures of high interest rates.
Persistently high interest rates increase the opportunity cost of holding non-yielding assets such as gold. The Federal Reserve’s stance on maintaining current rates until inflation further decreases, emphasized by Fed Vice Chair Philip Jefferson, continues to exert downward pressure on gold prices.
According to a Reuters poll, the Fed is expected to reduce the federal funds rate by 25 basis points in September and by 50 basis points in 2024.
Gold Prices Forecast
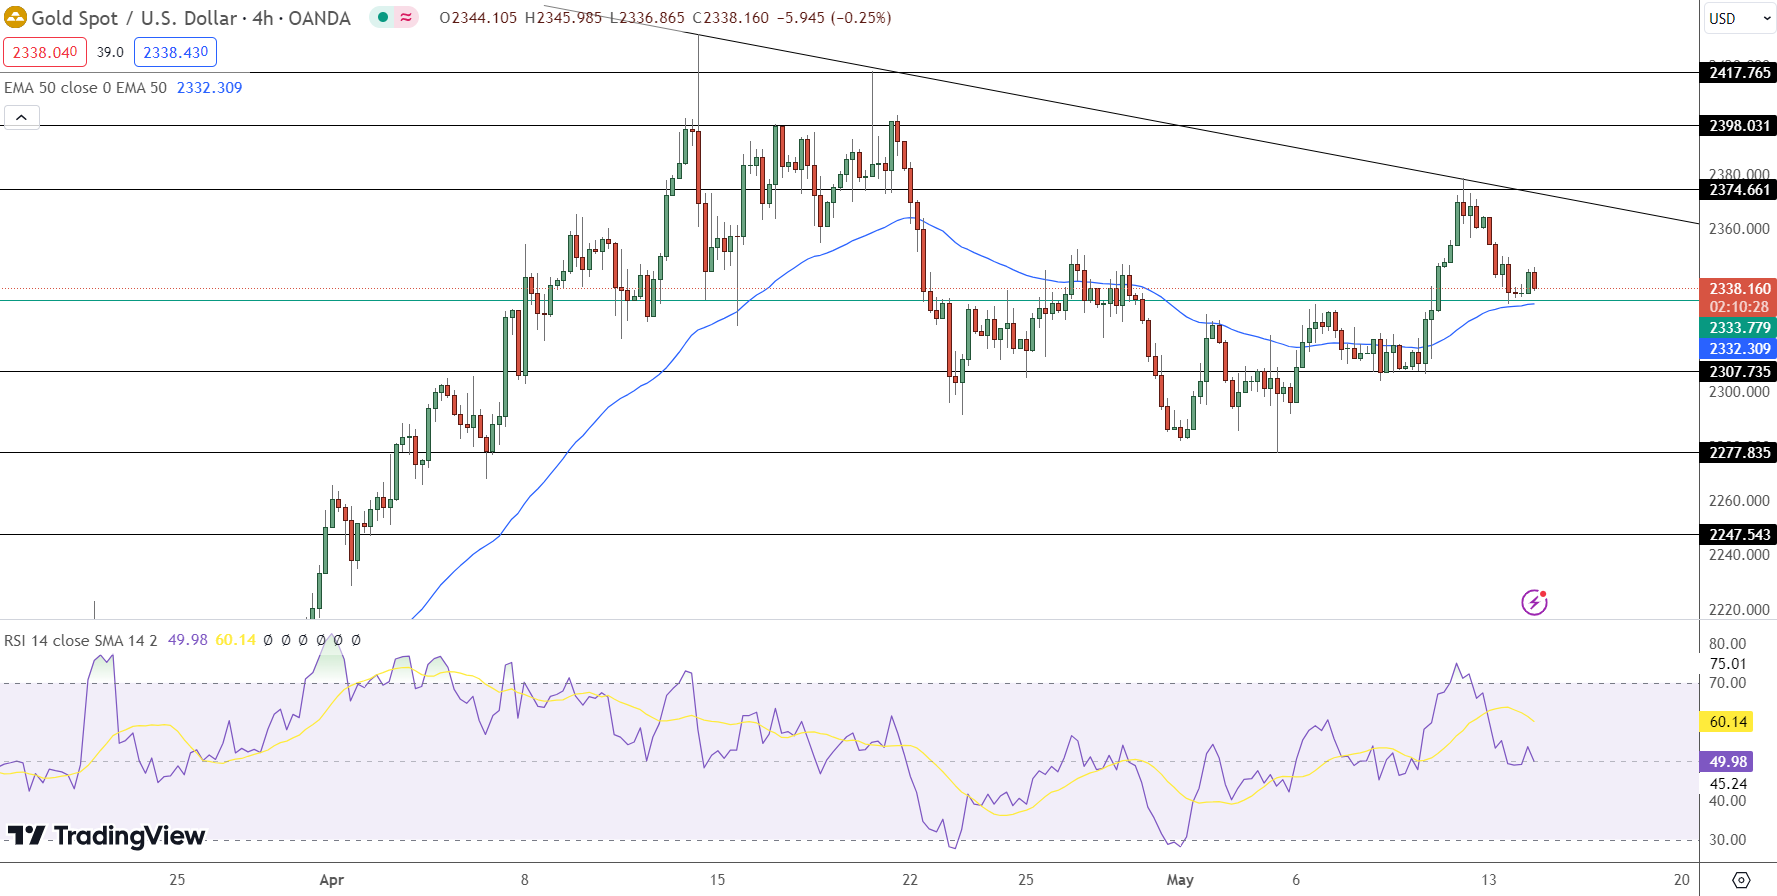
Gold (XAU/USD) is trading at $2338.90, up 0.34%. The 4-hour chart identifies a pivot point at $2334.65. Immediate resistance levels are at $2351.50, $2362.06, and $2379.06. Support levels are at $2322.77, $2307.12, and $2291.75.
The 50-day EMA stands at $2332.44, while the 200-day EMA is at $2299.62.Gold has shown a bullish pattern, forming an engulfing candle above $2334.65, followed by a double doji pattern, indicating a weakening downtrend.
Additionally, a 61.8% Fibonacci retracement around $2334 supports a bullish outlook. The trend remains positive above $2334.65, though a break below this level could lead to significant selling pressure.
- Check out our free forex signals
- Follow the top economic events on FX Leaders economic calendar
- Trade better, discover more Forex Trading Strategies
- Open a FREE Trading Account
- Read our latest reviews on: Avatrade, Exness, HFM and XM
Related Articles


Sidebar rates
Related Posts
