Ethereum Misery Compounds: ETH Inching Closer To $2,800 Floor
Ethereum is under pressure, failing to overcome the $3,000 resistance. Losses below $2,800 might trigger more price dumps
Ethereum is under immense liquidation pressure, and the downtrend momentum remains, regardless of upbeat supporters. The uptrend is capped due to weak Bitcoin and increasing fear that the United States SEC might classify the coin as a security. If that’s the case, it will be a severe blow for ETH in the medium to short term. The decision to classify the coin this way might also force prices lower, just like how XRP slipped when the regulator sued Ripple in late 2020.
At press time, ETH prices remain in the red, and this could be the state of affairs this week unless there is a sharp turn in fortune. According to trackers, the coin is stable on the last day and down 3% on the previous week. Should Ethereum bears force prices below the $2,800 floor, more losses could be in the offing. So far, trading volume is low, hovering at around $11 billion in the last trading day.
The following Ethereum news events will make or break the coin:
- Analysts are convinced the United States SEC considers ETH a security, looking at the response spot ETF applications are receiving. This classification automatically means the regulator won’t approve the product until there is a legal definition of the asset.
- After integrating EIP-1559 and introducing the base fee and burning feature, Vitalik Buterin wants the entire gas model overhauled. Now, through EIP-7706, the co-founder wants a new gas fee model for the call data. Layer-2 protocols now use the cheaper blobs after Dencun went live.
Ethereum Price Analysis
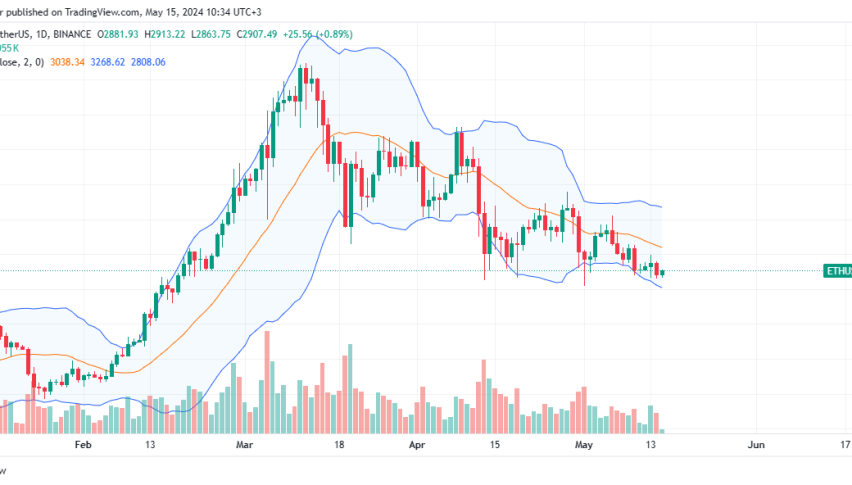
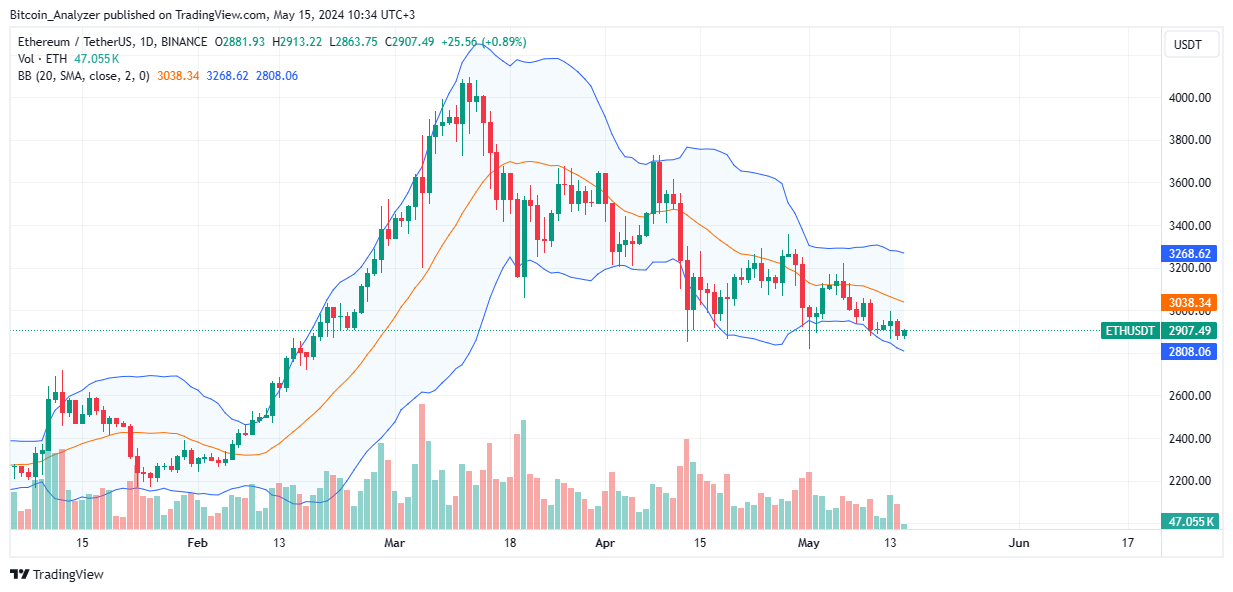
The overall ETH/USD structure remains bearish at spot rates.
As Ethereum prices print lower lows, momentum is fizzling. At the same time, prices continue to form a bull flag—considering the sharp gains in Q1 2024.
Technically, ETH has support at $2,800. On the upper side, resistance is at $3,300.
As mentioned earlier, any dump below $2,800—April and May lows—will likely trigger a massive sell-off, accelerating the drop to $2,600 and $2,200.
The drop’s velocity will be higher should the breakout bar have a higher trading volume than the recent average.
- Check out our free forex signals
- Follow the top economic events on FX Leaders economic calendar
- Trade better, discover more Forex Trading Strategies
- Open a FREE Trading Account
- Read our latest reviews on: Avatrade, Exness, HFM and XM
Related Articles


Sidebar rates
Related Posts
