MAs Support AUDUSD Technically, China Supports Fundamentally
The USD to AUD rate was consolidating earlier this month, but a bullish breakout occurred last week as the USD began to retreat after the da
The USD to AUD rate was consolidating earlier this month, but a bullish breakout occurred last week as the USD began to retreat after the weak economic data. This breakthrough corresponded with several bearish developments for the USD, such as poorer NFP statistics earlier this month and lower PPI and CPI inflation last week, pushing the price above the 200-day SMA.
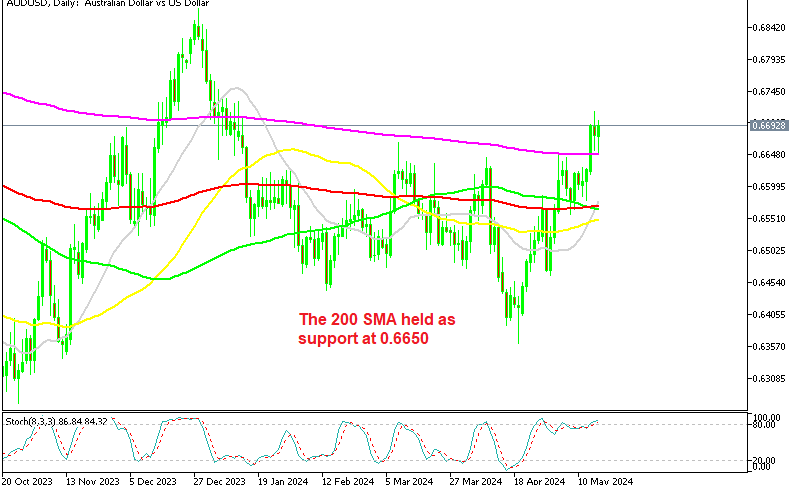
AUD/USD Chart Daily – Sellers Facing the 200 SMA As Support Now
The AUD/USD pair saw a significant rise last week, bolstered by a risk-on sentiment that followed disappointing US inflation data. The movement above the 200-day Simple Moving Average (SMA) was a key technical event, and the level around 1.2650 (the 200-day SMA) now serves as critical support, which means that it is a good level to go long on this pair during dips.
Today we had the 1-yer and 5-year 1-y Loan Prime Rate (LPR) decision from China, which is the benchmark lending rate set by the People’s Bank of China in its effort to influence short-term interest rates as part of its monetary policy strategy
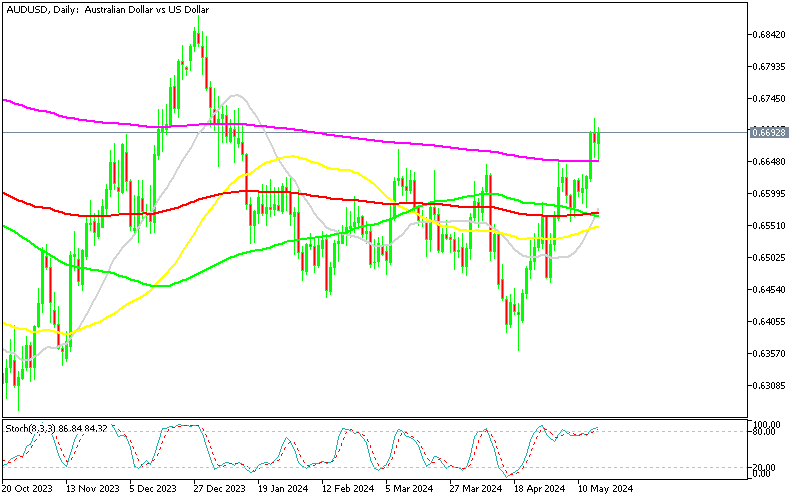
AUD/USD Live Chart
- Check out our free forex signals
- Follow the top economic events on FX Leaders economic calendar
- Trade better, discover more Forex Trading Strategies
- Open a FREE Trading Account
- Read our latest reviews on: Avatrade, Exness, HFM and XM
Related Articles


Sidebar rates
Related Posts
