Forex Signals Brief May 22: RBNZ, UK CPI and FOMC Minutes
Today we have major events in every session, with the RBNZ in Asia, the UK CPI inflation in Europe and FOMC minutes in the US session.
For the second day in a row, there were no significant economic data releases during the Asian and European sessions. However, the Canadian Consumer Price Index (CPI) report for April indicated a slowdown, resulting in the Canadian dollar (CAD) dropping by 50 pips across the board. The influence of comments from Federal Reserve officials remained fundamental, yet their statements were largely consistent with previous remarks from other Fed officials.

Market Overview:
- Currency Pair Activity: Five of the seven major currency pairs had trading ranges of just over 40 pips, indicating a generally tranquil market environment. The price action was characterized more by volatility rather than clear trends.
- CAD Reaction: The slowdown in the Canadian CPI contributed to a significant move in the CAD, highlighting the sensitivity of the currency to inflation data and its implications for monetary policy.
Key Resistance Levels:
- USD/JPY: The previous high of 156.80 remains a critical resistance level. A break above this could pave the way for the pair to target the 160 mark.
Market Sentiment:
- Fedspeak Influence: The primary driver of market sentiment has been the statements from Federal Reserve officials. Despite no new economic data from the United States, these comments have maintained their influence over market expectations and sentiment.
- Volatility vs. Trend: The overall price activity across major currency pairs has been more volatile than trending, reflecting a market in a wait-and-see mode, likely due to the lack of significant data releases and awaiting further direction from upcoming economic indicators or central bank decisions.
Today’s Market Expectations
Today started with the RBNZ meeting, which was held early in the morning. The decision by the Reserve Bank of New Zealand (RBNZ) to maintain the cash rate at 5.5% was largely in line with market expectations. However, the tone of the RBNZ’s statement appeared more hawkish than anticipated, which initially led to a spike in the NZD/USD pair. Despite this initial reaction, the price reversed immediately at the 100-weekly Simple Moving Average (SMA), underlining the significance of this technical level in influencing downtrends. The RBNZ’s unexpected hawkish stance suggests a stronger commitment to addressing inflationary pressures through monetary policy measures. However, market participants may have interpreted this as a signal that interest rate cuts could be on the horizon to counter inflation. Consequently, the NZD/USD pair experienced a brief surge before encountering resistance at the 100-weekly SMA.
The UK Consumer Price Index (CPI) year-on-year (Y/Y) forecast indicates a decline to 2.1%, compared to 3.2% in the previous year. Meanwhile, the Core CPI Y/Y is expected to decrease to 3.7%, down from 4.2% in the previous year. The Bank of England (BoE) places particular emphasis on services inflation, making it a crucial factor in shaping market expectations.
The FOMC Minutes which will be released later today, typically don’t lead to significant market movements because much of the information they contain is already anticipated by the market. By the time the Minutes are released, new data and developments often overshadow the contents, rendering them less impactful. However, there are occasions when the FOMC Minutes can offer valuable insights into the Federal Reserve’s internal deliberations and future policy directions. Traders and analysts closely scrutinize the Minutes for any hints of changes in monetary policy, economic assessments, and discussions on key issues like Quantitative Tightening (QT)
Yesterday the volatility was low again, with most major forex pairs consolidating in a 40 pip range, as traders await today’s major economic events such as the RBNZ meeting, the UK CPI inflation and the FOMC meeting minutes. We opened two forex signals, but none of them reached the targets.
Gold Consolidates Gains Above $2,400
GOLD (XAU/USD) achieved a significant milestone last week by closing above $2,400 for the first time in history, hinting at further highs in the near future. The market’s response to weaker-than-anticipated CPI data triggered a rush to safe-haven assets, including gold, propelling the XAU/USD pair back towards the $2,400 mark. The bounce from the $2,330 support level, previously a resistance during April’s consolidation phase, demonstrated robust market sentiment. Yesterday, gold prices surged further, reaching $2,450, bolstered by this recovery and supported by the 20-period Simple Moving Average (SMA) on the H4 chart. This consolidation above the $2,400 level, coupled with the SMA indicator, reinforces the bullish outlook for gold.
XAU/USD – H4 chart
USD/JPY Continues the Upside Move
The Bank of Japan’s intervention in early May caused a substantial shift in the USD/JPY exchange rate, resulting in a sharp decline of nearly 11 cents to approximately 151. However, this downward movement was swiftly met with buying interest, leading to a rapid reversal that propelled the pair back above 156. This pattern of intervention followed by a quick reversal highlights the bullish momentum in this pair, so we’re looking to open another buy signal on another pullback after the one we opened earlier this week hit the TP target.
AUD/USD – Daily Chart
Cryptocurrency Update
Booking Profit in Bitcoin As Buyers Push To $70K Again
The recent decline in Bitcoin’s price to approximately $61,000 created a buying opportunity for investors, as the 100-day Simple Moving Average (SMA) has become a support level. This aligns with our own position. Previously, technical indicators such as the 50-day and 20-day SMAs acted as resistance, hindering Bitcoin’s upward momentum. However, these resistance levels have now been surpassed, suggesting that the 50-day moving average is likely to become a new support level on the daily chart. On Monday, Bitcoin reached $70,000, further confirming the bullish trend. This upward movement highlights the resilience of Bitcoin and the strong buying interest at lower levels, suggesting that the cryptocurrency market remains optimistic about Bitcoin’s potential for further gains.
BTC/USD – Daily chart
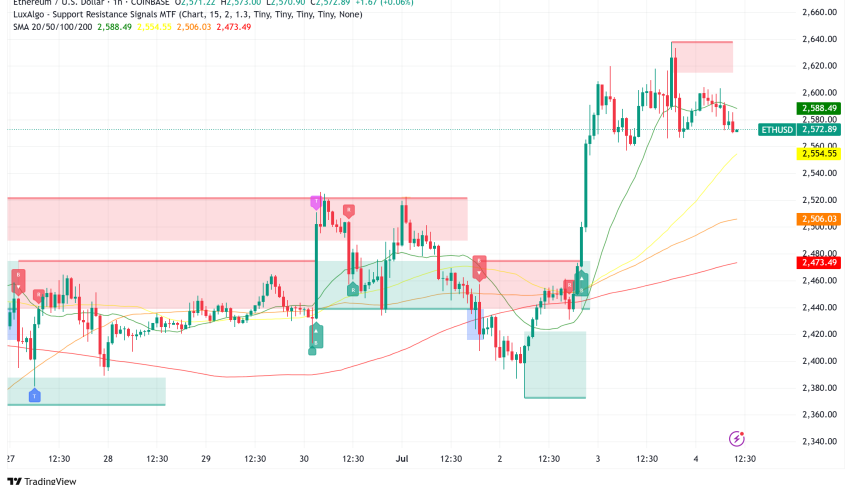
Ethereum Heads for $4,000 Ahead of the ETH ETF Approval
The SEC’s approval of the Bitcoin ETF in January significantly boosted sentiment in the cryptocurrency market. Now, with the anticipation of a spot Ethereum ETF, bids in the cryptocurrency market have surged once again. The SEC’s more favorable stance on spot Ether ETFs has bolstered market confidence, pushing Ether to a recent high of $3,832.50. Ethereum has continued its upward trajectory, rising from a low of $3,049 yesterday. This rapid increase has propelled Ethereum’s price up by more than 25% in just two days. The renewed optimism around the potential approval of a spot Ethereum ETF is driving this strong market performance, indicating robust investor interest and confidence in Ethereum’s future prospects.
ETH/USD – Daily chart
- Check out our free forex signals
- Follow the top economic events on FX Leaders economic calendar
- Trade better, discover more Forex Trading Strategies
- Open a FREE Trading Account