Gold (XAU/USD) Price Forecast: Trading at $2,338 Amid Middle East Tensions and Strong US Data
Despite strong U.S. economic data and a bullish U.S. dollar, the price of Gold (XAU/USD) managed to halt its early-day downward

Despite strong U.S. economic data and a bullish U.S. dollar, the price of Gold (XAU/USD) managed to halt its early-day downward trend and regain traction around the $2,338 level, reaching an intraday high of $2,340.
This upward movement can be attributed to risk-off market sentiment triggered by increasing geopolitical tensions in the Middle East, boosting safe-haven assets, including Gold.
Geopolitical Tensions in the Middle East Support Gold Prices
Tensions in the Middle East are contributing to higher demand for gold as a safe-haven asset. Over 900,000 Palestinians have been displaced in two weeks, facing severe shortages of essentials.
Hospitals in Gaza are struggling without fuel, and Israeli forces are advancing, exacerbating the humanitarian crisis. The death toll has surpassed 35,800, with over 80,011 wounded. This heightened geopolitical uncertainty is supporting gold prices.
US Economic Strength and Fed Outlook Drive Gold Price Downward
On the U.S. front, robust economic data has bolstered the US dollar, hinting at the possibility of higher interest rates, consequently putting pressure on Gold prices.
Atlanta Fed President Raphael Bostic highlighted concerns about inflation, suggesting the Fed might delay rate cuts to prevent overheating the economy.
According to the CME FedWatch Tool, the likelihood of the Fed maintaining rates in September rose from 41.9% to 48.4% on May 23rd.
US Initial Jobless Claims dropped by 8,000 to 215,000 for the week ending May 18, beating expectations. The flash US S&P Global Manufacturing PMI rose to 50.9 in May from April’s 50.0, while Services PMI climbed to 54.8 from 51.3. The US S&P Global Composite PMI surged to 54.4 in May from April’s 51.3, marking its highest level since April 2022. These strong data points have pressured Gold prices lower.
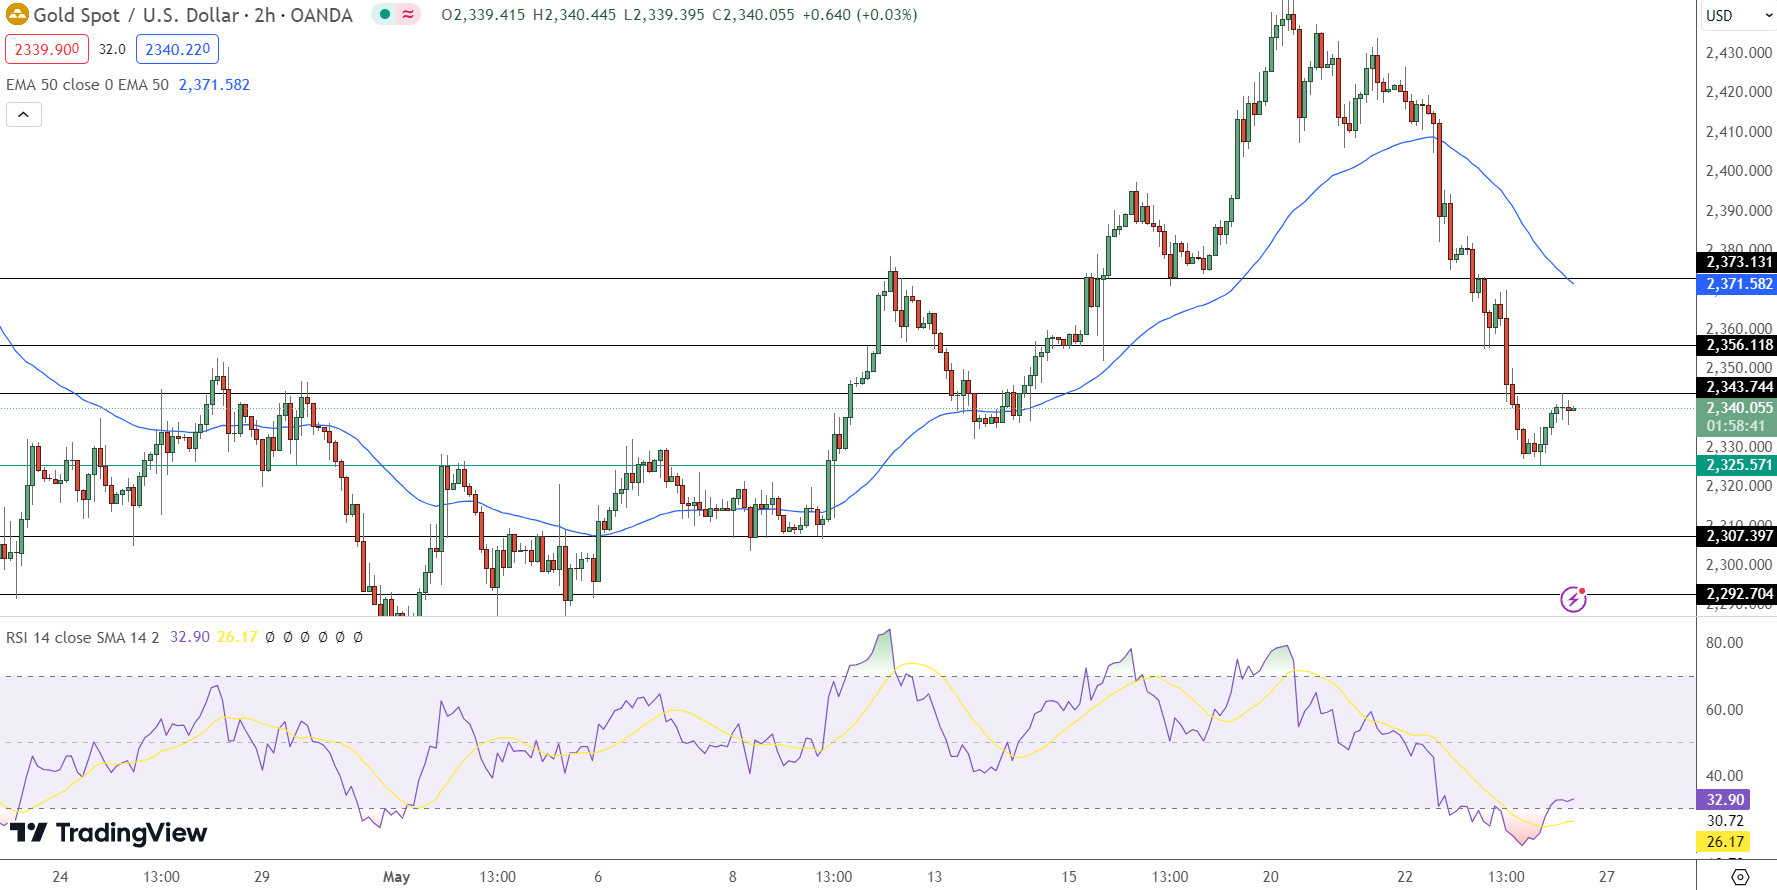
Gold Price Forecast: Technical Outlook
Gold (XAU/USD) is currently trading at $2,338.97, up 0.21%. The technical outlook suggests a bullish trend as the price is positioned above the pivot point of $2,326.84.
Immediate resistance is observed at $2,352.61, with subsequent resistance levels at $2,368.37 and $2,392.98. On the downside, immediate support is noted at $2,307.23, followed by $2,291.85 and $2,277.62.
The Relative Strength Index (RSI) is currently at 31, indicating that gold is approaching oversold conditions, which could suggest a potential reversal or stabilization. The 50-day Exponential Moving Average (EMA) is at $2,386.60, providing significant resistance near the upper levels.
Traders should consider an entry price for buying above $2,327, with a take-profit target of $2,358 and a stop-loss set at $2,307. This strategy leverages the potential for further upside while managing risk.
- Check out our free forex signals
- Follow the top economic events on FX Leaders economic calendar
- Trade better, discover more Forex Trading Strategies
- Open a FREE Trading Account
- Read our latest reviews on: Avatrade, Exness, HFM and XM
Related Articles


Sidebar rates
Related Posts
