Forex Signals Brief May 28: Back to Trading After A Long Weekend
Today the UK and US markets will reopen after a long weekend, which will bring volatility back.

Despite Memorial Day in the US and the Spring Bank Holiday in the UK, market activity persisted, albeit at a slower pace. The declining trend of the US dollar continued, contributing to a positive market sentiment. The pound sterling and commodity-linked currencies benefited the most from the risk-on environment.
While European Central Bank (ECB) official Philip Lane expressed caution regarding rate cuts without specific triggers, the optimistic momentum from the previous Friday persisted. This sentiment translated into strong gains in the European stock market. As North American trading commenced, selling pressure on the US dollar intensified, potentially due to increased liquidity entering the market.
This led to consistent bids in the pound sterling and minor declines of around 20 pips in the US dollar. Additionally, news of a soldier killed by Israeli gunfire in Egypt prompted a brief uptick in gold prices. However, the gains were largely reversed later, suggesting that the initial reaction may have been based on mistaken identification.
This Week’s Market Expectations
Today it started with the retail sales from Australia, which were expected to show a 0.3% increase after a -0.4% contraction in March. However, there was only a 0.1% increase in retail sales for April, which is marginal and indicates that consumers are still cautious about spending. The improvement from March’s -0.4% decline shows some resilience but is not robust enough to signal a strong recovery in consumer confidence or spending power.
Consumer confidence in the US is expected to experience a slight decline in May, dropping to 95.9 from April’s level of 97.0. However, the most recent data fell significantly short of expectations, reaching its lowest point since July 2022. According to the Chief Economist of the Conference Board, this decline in confidence stems from consumers’ concerns about future business conditions, job availability, and income, leading to decreased optimism regarding the labor market in April. Despite the overall decline in the index for April, it’s worth noting that optimism about the current state of affairs has outweighed concerns about the future since mid-2022. Additionally, since the Present Situation Index is typically considered a leading indicator of the unemployment rate, it will be crucial to monitor its movements closely for insights into the labor market’s health.
Today the USD resumed the decline, while the price of Gold started bouncing higher after finding support at moving averages on Friday. The tensions in the Middle East gave safe havens a boost, which caught us on the wrong side after we were short on Gold during the decline last week. However, in forex the volatility wasn’t too high and we had a couple of winning forex signals.
Gold Bounces off the 100 SMA
Gold (XAU/USD) surged to a new record high of $2,450 early last week but then reversed direction in the second half of the week, falling to lows of $2,325. However, XAU/USD found support at the 100-day Simple Moving Average (SMA) on Friday, rebounding to $2,350 yesterday, which is 1.50% higher than last week’s low. This recovery suggests that a broader uptrend in the commodities market is driving the rise in gold and other commodity prices, rather than just geopolitical concerns. The resurgence in gold, along with similar increases in silver and a bounce back in copper, highlights a general bullish trend in the metals market. Given the current global uncertainties, investors appear to be seeking refuge in these assets, reinforcing their status as safe havens. This broader market movement suggests a renewed confidence in the value of precious and industrial metals amid ongoing economic and geopolitical instability.
XAU/USD – Daily chart
EUR/USD Remains Bullish
Before beginning a downward trend last week, the EUR/USD had been on a consistent positive trajectory for several weeks. As the price dropped towards 1.08, it fell short of breaching that level, suggesting that this area has turned into support. Despite the strong US durable goods orders report, the 200 SMA (purple) continued to act as a robust support level. On Friday, a bounce off this moving average was observed, indicating that the overall trend for this forex pair remains favorable. This resilience suggests that traders are still bullish on the EUR/USD, even in the face of positive US economic data. The 200 SMA’s support is a key technical indicator that can offer traders confidence that the EUR/USD could maintain its upward momentum, at least in the short term. This bounce back from the 200 SMA indicates that the pair may continue to find buyers around this level, supporting further advances as long as other economic and technical indicators align favorably.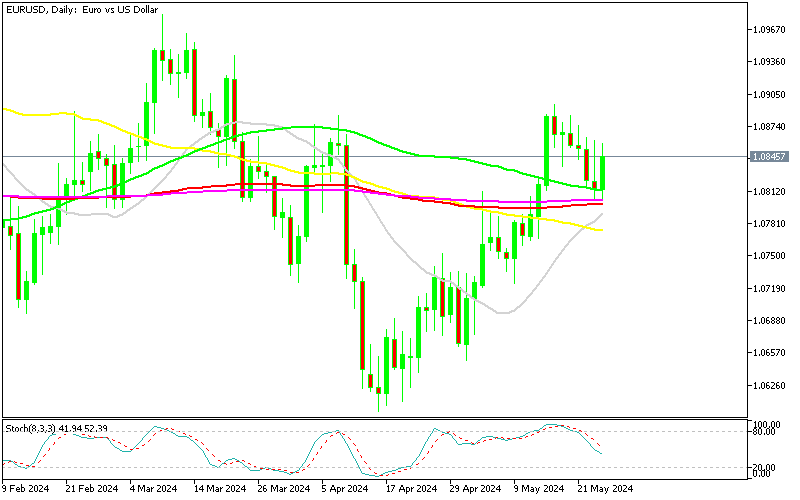
EUR/USD – Daily Chart
Cryptocurrency Update
Bitcoin Touches $70K Again
The dip in Bitcoin’s price to around $61,000 presented a potential buying opportunity for investors. The 100-day Simple Moving Average (SMA) is now acting as a support level, reinforcing the belief that the long-term trend for Bitcoin remains upward. Historically, Bitcoin’s upward momentum has encountered resistance from technical indicators like the 20-day and 50-day SMAs. However, as observed on the daily chart, Bitcoin has surpassed these resistance levels, suggesting that the 50-day SMA is likely to turn into a new support level. Despite the recent three-day decline, Bitcoin’s upward momentum remains intact, demonstrated by its surge above $70,000 on Monday. This resilience indicates that the market’s perception of Bitcoin remains positive, even with the current price drop. Investors and traders might view this correction as a consolidation phase within the broader bullish trend, potentially setting the stage for future gains.
BTC/USD – Daily chart
Ethereum Within Reach of $4,000
Sentiment in the cryptocurrency market was significantly bolstered earlier this week by signs that the SEC might approve an Ethereum ETF in January. However, there was no immediate market reaction following the official approval yesterday. Despite this, Ether (ETH) has surged to a new high of $3,832.50, driven by the market’s increased confidence stemming from the SEC’s more optimistic stance on spot Ether ETFs. Ethereum’s price has experienced a strong upward trajectory after hitting a low of around $3,000. This impressive rise has resulted in a nearly 25% increase in Ethereum’s value. Given this explosive growth, we decided to close our buy Ethereum signal at a profit yesterday, capitalizing on the bullish momentum.
ETH/USD – H4 chart
- Check out our free forex signals
- Follow the top economic events on FX Leaders economic calendar
- Trade better, discover more Forex Trading Strategies
- Open a FREE Trading Account
- Read our latest reviews on: Avatrade, Exness, HFM and XM
Related Articles


Sidebar rates
Related Posts
