USDJPY 3 Cent Down, Japan Cash Earnings Higher
The bullish trend in USDJPY has been strong, but sellers have prevailed this week, with USD/JPY down 3 cents from Monday's high
The trend in the USDJPY rate has been rather optimistic, with buyers continuing to buy USD/JPY dips even after the Bank of Japan intervened, but sellers have prevailed this week, and USD/JPY is 3 cents lower than its Monday high. Last night’s Japanese Average Cash Earnings were favourable, but there wasn’t any price action.
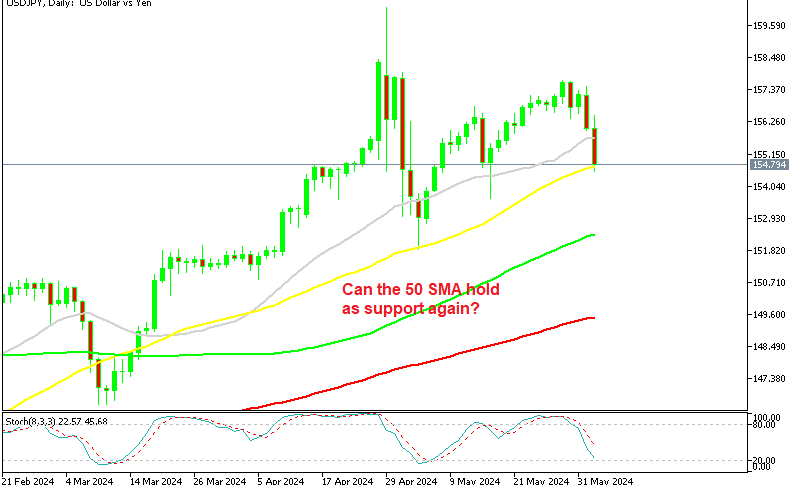
USD/JPY Chart Daily – Sellers Face the 50 SMA Now
USD/JPY has shown significant bullish strength versus the Japanese yen, with the pair reaching 157.70 last week, but this week sellers have prevailed, weighing on this pair and sending it around 300 pips lower. This has been a dramatic decline, with the price dropping to the 50 SMA (yellow) on the daily chart. The risk sentiment has turned quite negative this week, which has been weighing on stock markets and supporting safe havens such as the CHF and the JPY.
Another reason for the retreat has been USD weakness following some disappointing US data this week, such as ISM manufacturing on Monday and JOLTS JOB Openings reports yesterday, both of which were quite lacklustre and caused a significant drop in US bond yields. This statistics highlighted the resilience of the US labour market, a good signal for economic development that allayed some recession fears following numerous negative economic indicators from the US last month.
Earlier today we had the Average Cash Earnings from Japan, which were expected to show a jump to 1.7% year-on-year in May, while the number for May was revised higher as well to 1.0% from 0.6% previously.
May Average Cash Earnings from Japan
- April total cash earnings +2.1% y/y vs +1.8% expected (real wages -0.7%)
- March total cash earnings +1.0%
- Real Cash Earnings (i.e. after inflation) -0.7% YoY vs -0.9% expected
- Previous Real Cash Earnings YoY were -2.1%
- Regular pay, says the stats people, is +2.3% y/y (overtime -0.6%), its quickest rise since October of 1994.
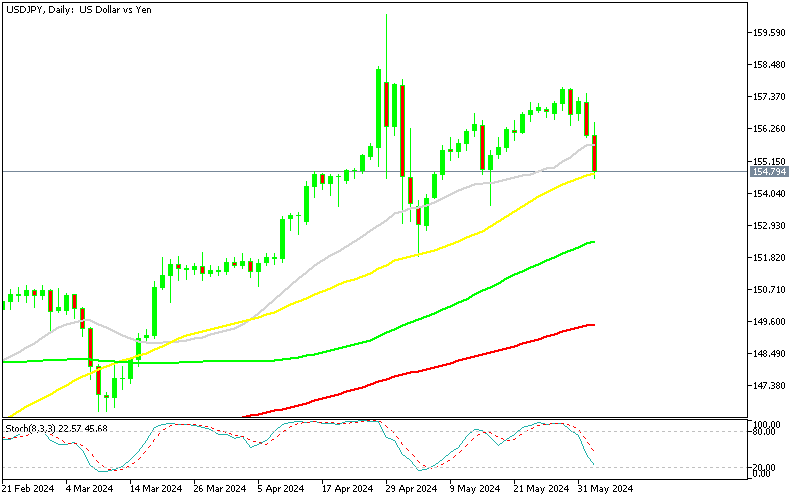
USD/JPY Live Chart
- Check out our free forex signals
- Follow the top economic events on FX Leaders economic calendar
- Trade better, discover more Forex Trading Strategies
- Open a FREE Trading Account
- Read our latest reviews on: Avatrade, Exness, HFM and XM
Related Articles


Sidebar rates
Related Posts
