FTSE Starts the Day With a Rally – GDP Data in line With Expectations
GDP data was worse than forecast but good enough to keep stock investors bullish as they ponder on the BoE getting closer to cutting rates.
GDP data was worse than forecast but good enough to keep stock investors bullish as they ponder on the BoE getting closer to cutting rates.
For April, GDP was as forecast at 0.00% MoM from 0.4% last month, while YoY there was a smaller drop to 0.6% from 0.7% previously. Usually, weak economic growth punishes the stock market.
However, in the current central bank policy environment the market is more bullish about monetary easing than bearish about weak data. This type of data is seen as positive towards convincing the BoE that the time to cut rates is getting closer.
This afternoon all eyes will be on U.S. inflation data, which is expected to remain flat on last month’s reading at 3.4%. While Core inflation is expected to decline slightly to 3.5% from 3.6%.
In my opinion, this small decline in inflation isn’t enough for the Fed to start considering action in monetary policy. Fed officials have said on numerous occasions that monetary easing is dependent on data.
And by that they mean data that shows inflation is getting closer to their target of 2.0%. I would imagine it’s going to take a sharper drop to convince the Fed it’s time to act on interest rates. No doubt, the market might think differently.
On Wednesday we will hear what the Fed chair has to say after the scheduled FOMC meeting. Which I would imagine will be a statement in line with previous press conferences, that is they need to see data that justifies a rate cut.
Technical View
The day chart for the FTSE below shows a retracement leg of a main bullish trend that hit a major support. The market bounced off the 0.382 Fibonacci level at 8,143, which also coincided with support from the Ichimoku cloud.
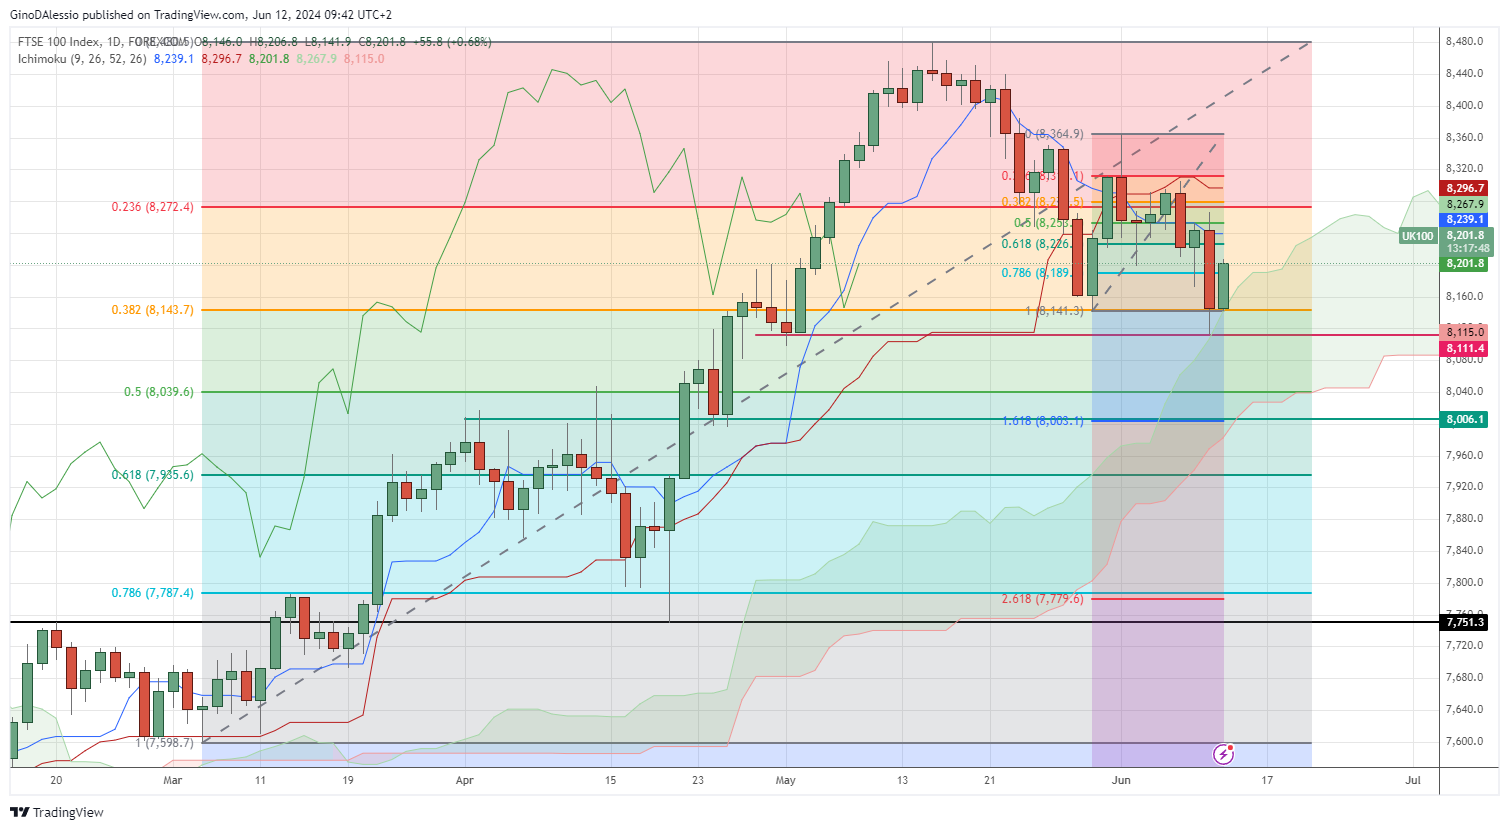
Today’s candle has broken the resistance of the 0.786 Fibo retracement level of 8,189, and the next resistance will be at the 0.618 Fibo level of 8,226. These Fibo levels belong to the correction in the retracement to the cloud, which started on May 30 and ended at 8,364 on June 3.
Today’s candle closing green would indicate that the market has found support from the cloud and an important Fibo level. I would expect further highs over the next trading sessions. The next major resistance is from the 0.236 Fibo level of 8,272.
- Check out our free forex signals
- Follow the top economic events on FX Leaders economic calendar
- Trade better, discover more Forex Trading Strategies
- Open a FREE Trading Account
- Read our latest reviews on: Avatrade, Exness, HFM and XM
Related Articles


Sidebar rates
Related Posts
