CAC Tumbles Further on Hawkish Concerns from the ECB – Set to End the Week Down 4.75%
The CAC index continues its decline today with hawkish sentiment in full control. Recent comments from ECB officials and bad EU elections re


The CAC index continues its decline today with hawkish sentiment in full control. Recent comments from ECB officials and bad EU elections results weigh on the market.
The stock market has seen growing concerns about interest rates remaining high for longer. ECB officials have warned on multiple occasions that further rate cuts will need to be backed by data showing inflation is declining.
The Fed also advised that interest rates won’t be coming down anytime soon. This stance adds to the perception that the ECB will have trouble cutting rates again before the Fed. This is mainly due to a weakening euro.
The interest rate differential is already in favor of the US dollar which is creating pressure on the forex rate. Further cuts by the ECB ahead of Fed action would further increase the appeal of carry trades long dollar and short euro.
I don’t see the ECB cutting rates again until the Fed has enacted monetary easing which is more than likely to be no earlier than the last quarter. In the meantime, France is facing an early general election after Macron lost at the EU parliament election by a large margin.
Technical View
The day chart below for the CAC shows a market that has failed to break its all-time high, creating a double top (points A and B). The following retracement met support at the Ichimoku cloud.
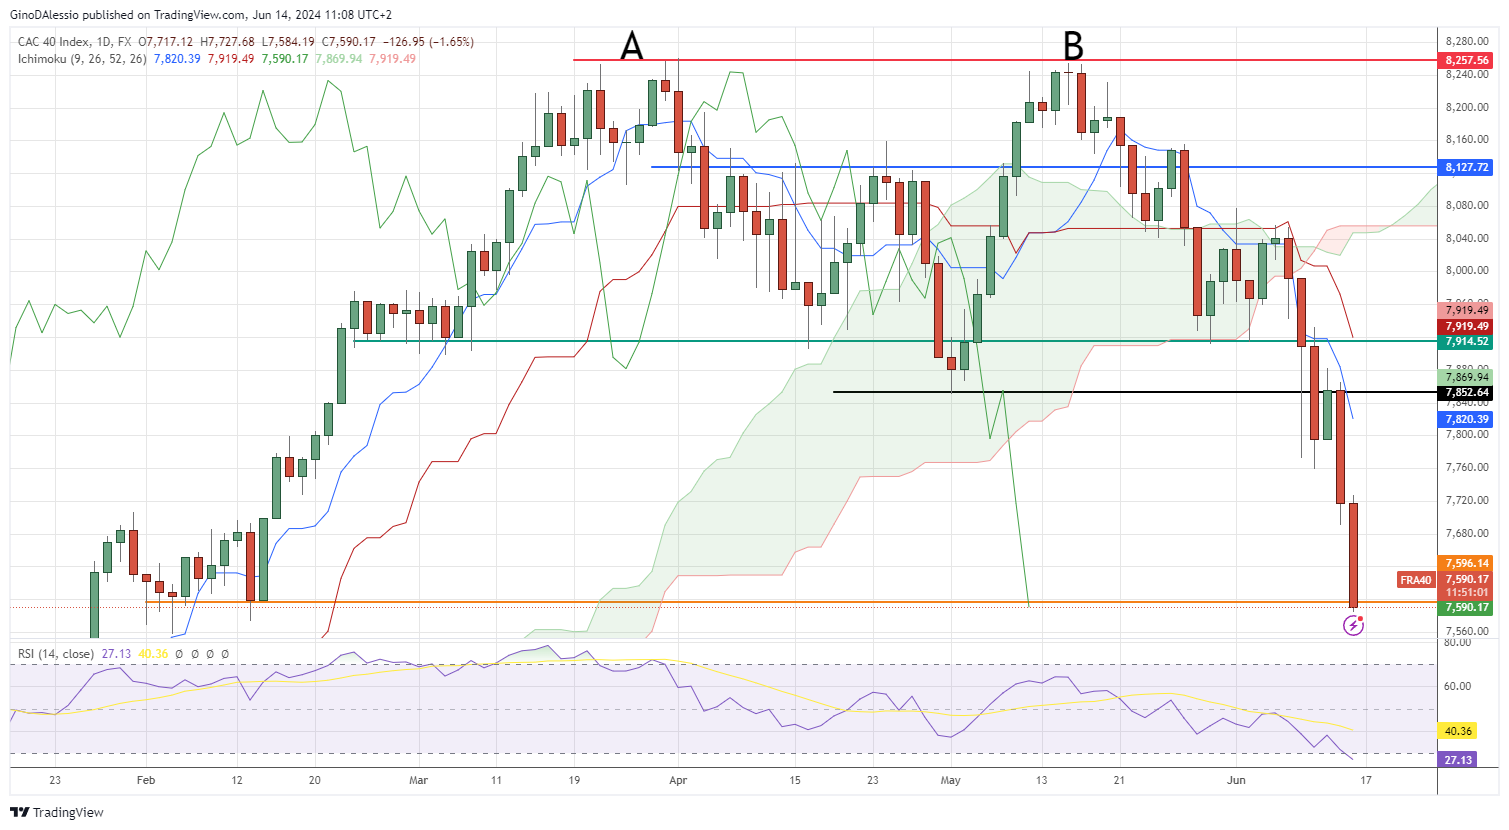
After 8 sessions hovering within the cloud the market broke out to the downside. After which, the market broke the two major support levels (green and black lines) with ease. Today’s candle is now finding support on the previous support area from February, which led to the surge to the ATH.
The next major support level is at 7,502 a level set by a previous ATH in July 2023. Having said that the current market has reached an RSI of 27.03. A very strong trend can keep the RSI below 30 for various days.
However, the most common reaction is a retracement from current levels when the RSI shows oversold or overbought levels on the day chart.
- Check out our free forex signals
- Follow the top economic events on FX Leaders economic calendar
- Trade better, discover more Forex Trading Strategies
- Open a FREE Trading Account
- Read our latest reviews on: Avatrade, Exness, HFM and XM
Related Articles


Sidebar rates
Related Posts
