Solana Stumbles Amid Market Downturn, But New Oracle Offers Hope
Solana (SOL) has felt the sting of the recent crypto market correction, dropping over 7% in the past 24 hours. Despite the short-term
Solana (SOL) has felt the sting of the recent crypto market correction, dropping over 7% in the past 24 hours. Despite the short-term bearish trend, there are positive developments for the Solana ecosystem, including the launch of Pyth Network’s pull oracle.
Pyth Network Launches Pull Oracle on Solana
This innovative technology offers several advantages over its predecessor, the push oracle, including:
- Increased reliability through user-controlled price updates.
- Faster data updates for real-time DeFi transactions.
- Broader range of price feeds for diverse applications.
- Access to historical price data for accurate settlements and enhanced security.
- Support for new and evolving blockchain environments.
Solana Trading Volume Surges
Despite the market crash, Solana’s 24-hour trading volume jumped 153%, suggesting potential investor interest and a possible price surge. Active addresses on the network are also on the rise, reaching record highs in May and remaining strong in June.
Open Interest and the Fear & Greed Index
Solana’s Open Interest (OI) has been declining, reflecting a general outflow of money from the asset class. However, strong support exists around $1.36 billion, potentially indicating a future inflow. The Bitcoin Fear & Greed Index remains in “Greed” territory despite falling prices, creating confusion among some crypto users.
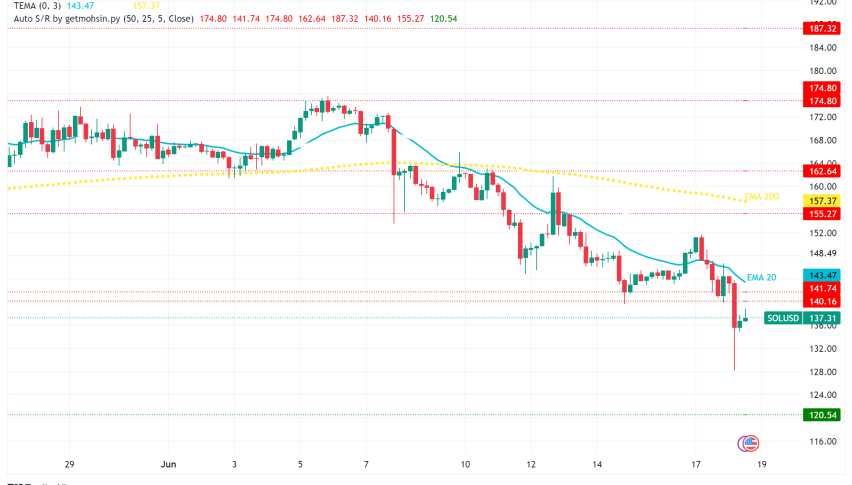
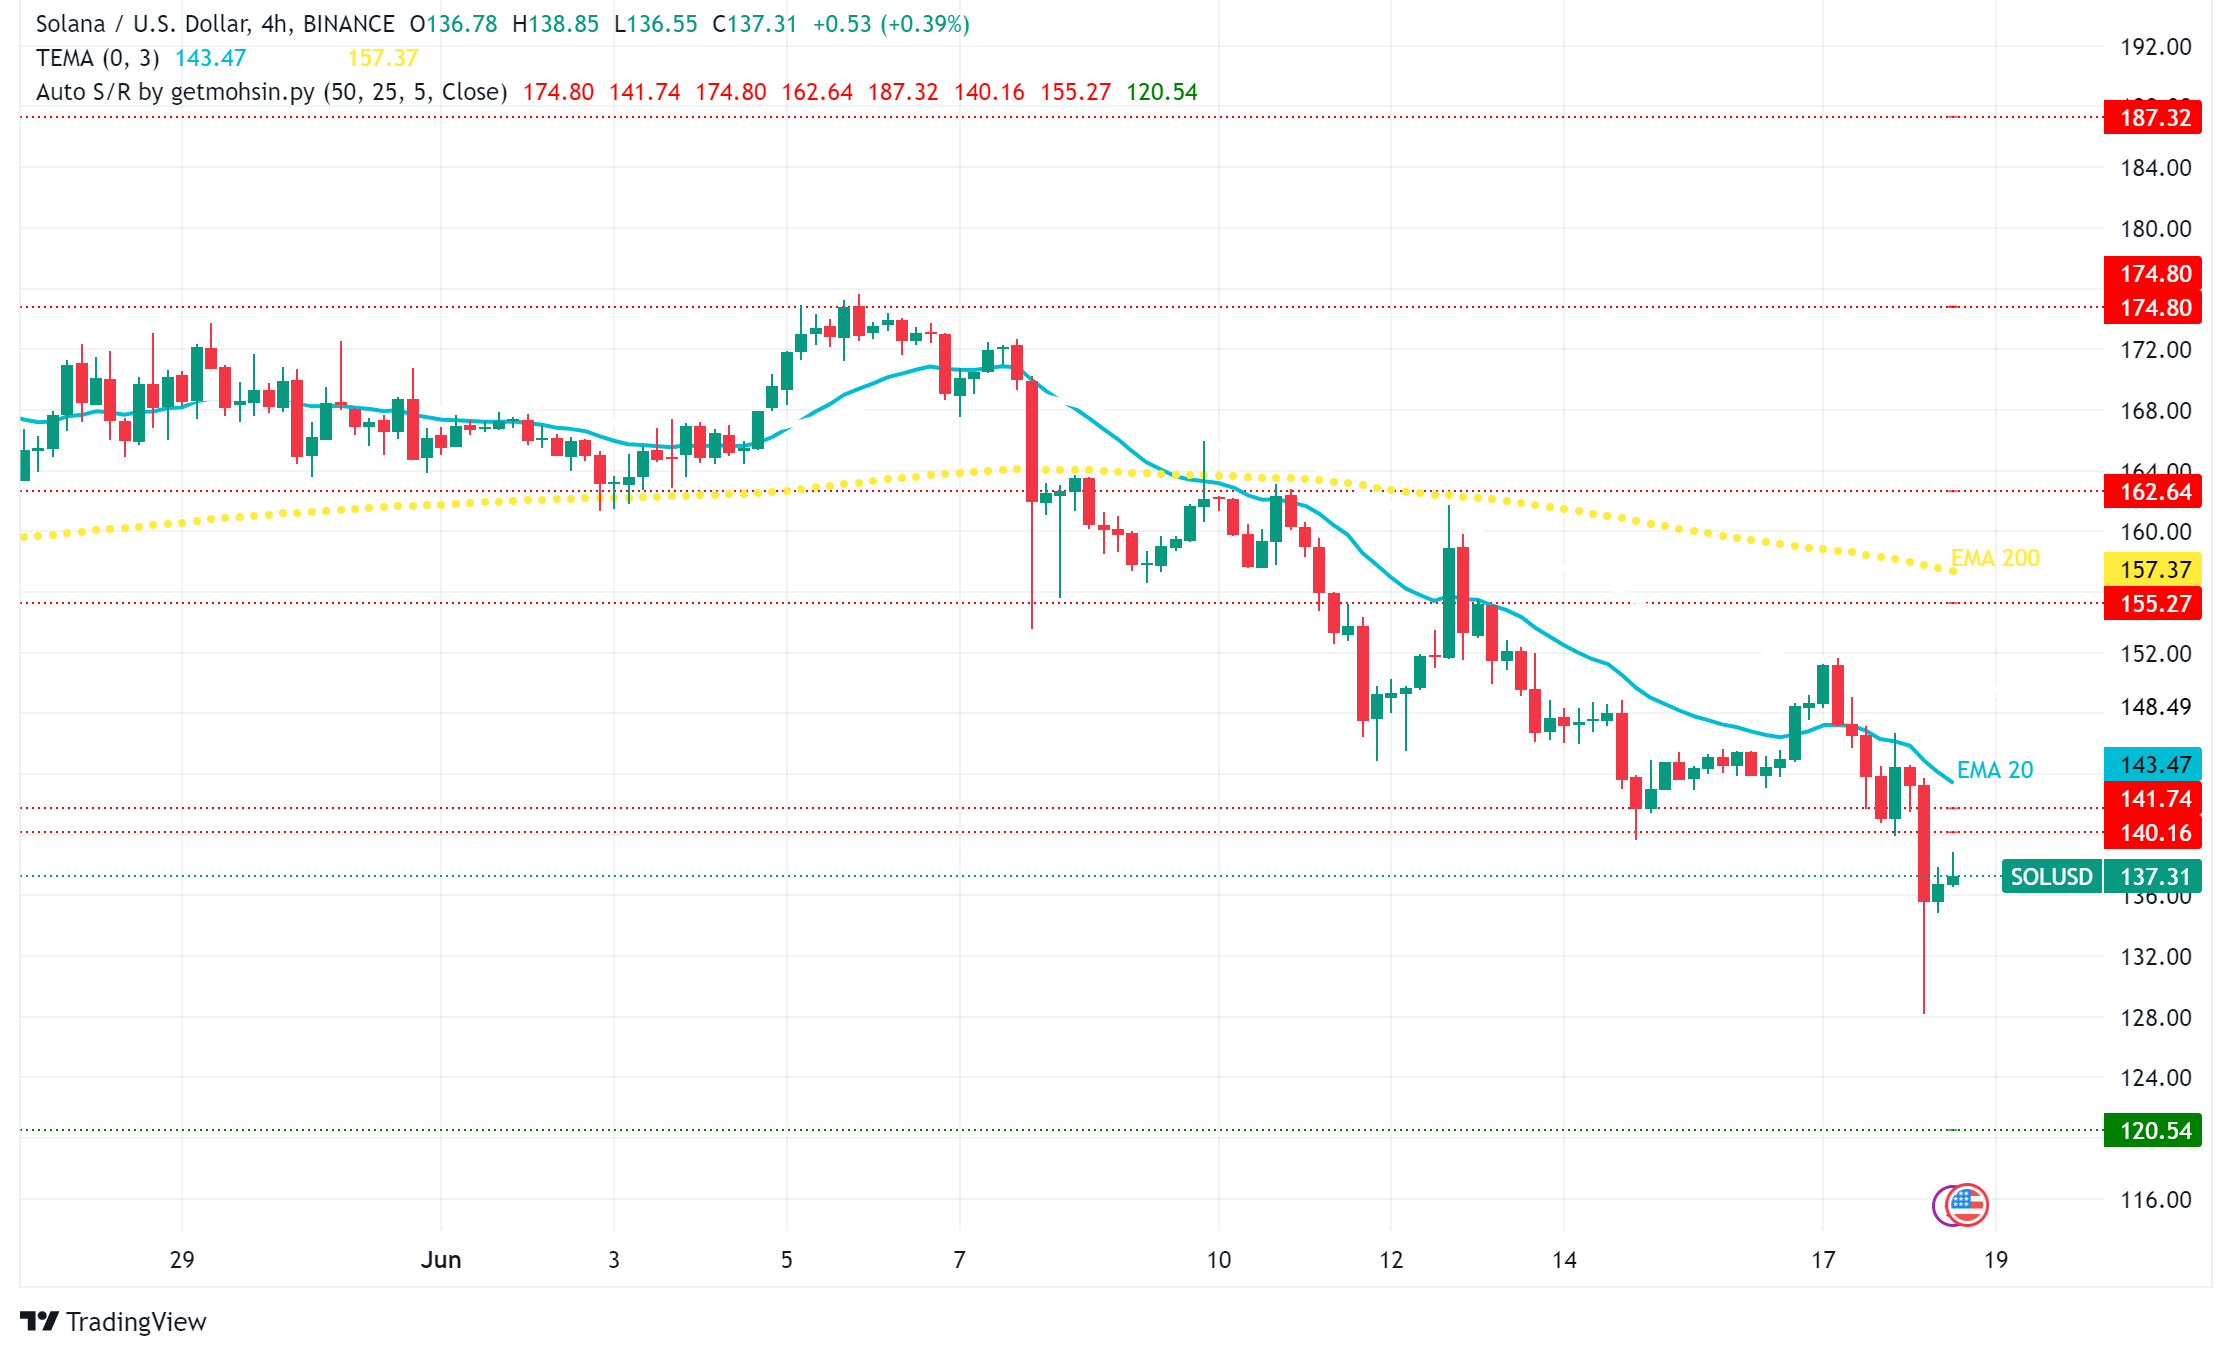
Solana Price Analysis
SOL price has been trading in a bearish channel for the past month. It currently sits at the 5th position in market capitalization, having lost $20 billion recently. The token faces resistance at the 50-day EMA and needs to hold above $127 for a potential bullish reversal.
Is Solana Bullish or Bearish?
A break above the resistance level of $155 could signal a move towards $181.50. Conversely, a break below $127 could see SOL retest $100.
SOL/USD Technical Indicators Offer Mixed Signals
Solana is currently trading below the 50-day SMA but above the 200-day SMA, indicating a tug-of-war between bulls and bears. A break above the symmetrical triangle on the chart could lead to a 63% rally towards $292.
- Check out our free forex signals
- Follow the top economic events on FX Leaders economic calendar
- Trade better, discover more Forex Trading Strategies
- Open a FREE Trading Account
- Read our latest reviews on: Avatrade, Exness, HFM and XM
Related Articles


Sidebar rates
Related Posts
