Ethereum in Limbo: Price Tumbles Amid Market Downturn, But Hope Flickers with ETF Launch on Horizon
Ethereum (ETH) has fallen victim to the broader crypto market slump, currently trading below $3,200 after a significant drop in the last 24
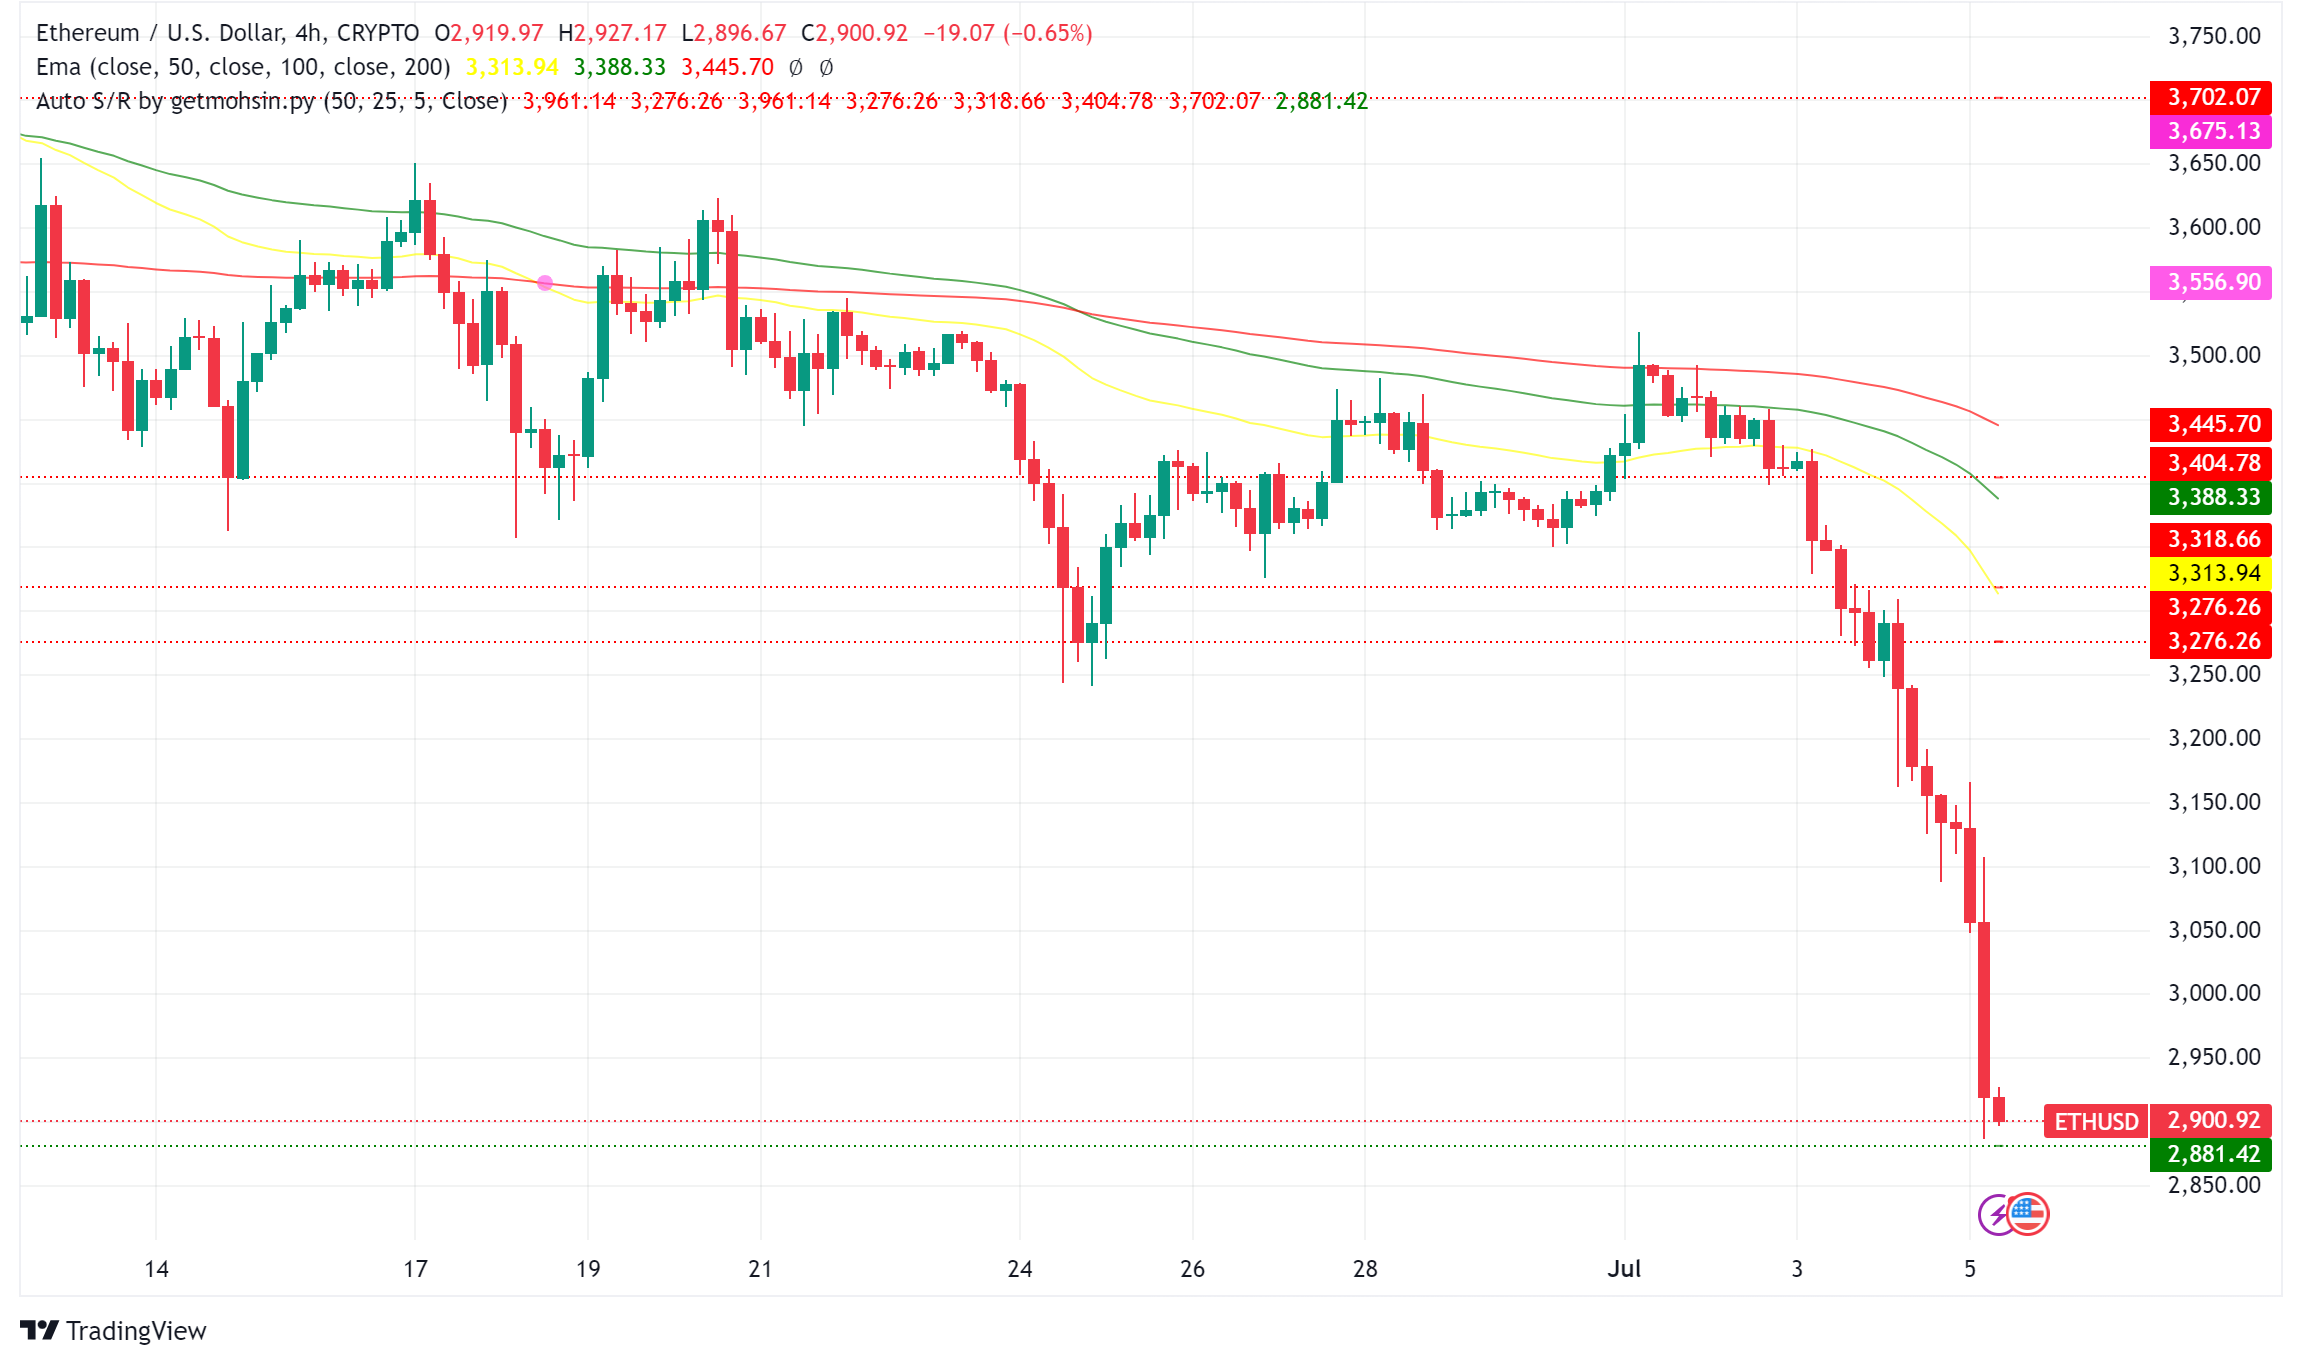
Ethereum (ETH) has fallen victim to the broader crypto market slump, currently trading below $3,200 after a significant drop in the last 24 hours. Despite the bearish sentiment, the potential launch of long-awaited Ethereum ETFs in July is injecting a dose of optimism.
A Tumultuous Week for Ethereum
Ethereum has mirrored Bitcoin’s recent woes, experiencing a price decline of roughly 6.2% to reach its current trading price. This downturn has resulted in substantial losses for many investors, with over $76 million in Ethereum-related liquidations occurring in the past 24 hours.
Dwindling Open Interest and Rising Leverage
Market intelligence platforms Santiment and CryptoQuant paint a concerning picture, revealing a decline in Ethereum’s open interest and a rise in its Estimated Leverage Ratio. This suggests a decrease in investor participation and an increased risk of volatility due to leveraged positions.
A Glimmers of Hope: dApp Activity on the Rise
Not all signs are bearish, however. AMBCrypto reports a recent uptick in Ethereum’s decentralized application (dApp) volume, indicating continued activity within certain sectors of the Ethereum ecosystem.
Analysts Eye Recovery Fueled by ETFs
While the present is marked by uncertainty, some analysts remain optimistic about Ethereum’s future. Analysts at QCP identify positive indications within the options market, including a rise in bullish bets and active trading in September and December options contracts. These signs suggest that investors are anticipating a price recovery, potentially driven by the approval of the first spot Ethereum ETFs.
ETFs: A Potential Billion-Dollar Influx?
Industry experts are abuzz with predictions about the launch date of these long-awaited ETFs, with some speculating a mid-July debut. If approved, Bitwise’s CIO, Matt Hougan, believes Ethereum could see an influx of $15 billion within the first 18 months. This surge could be further fueled by clearer regulations and increased adoption of stablecoins in the United States.
ETH/USD Technical Analysis Paints a Mixed Picture
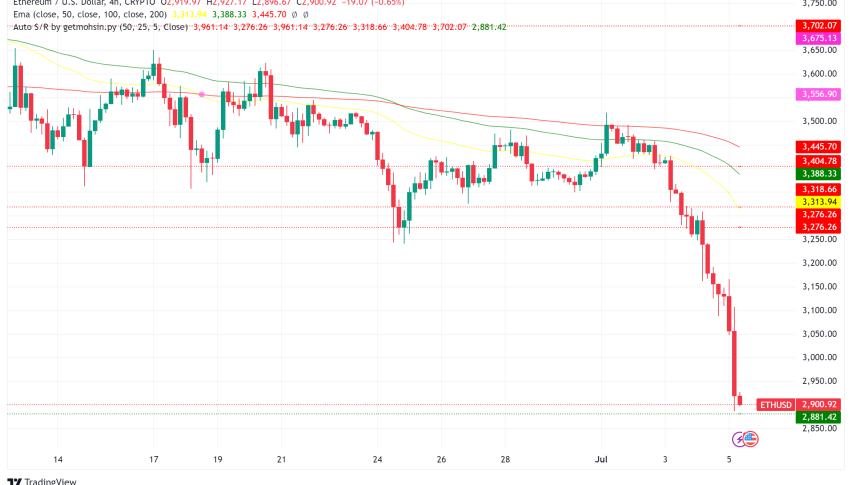
Technical indicators offer a conflicting view. While bearish signals dominate, there’s a possibility for a correction in the near future. If a recovery does materialize, it could face resistance around the $3,000 mark.
Key Levels to Watch
- Support: $2,800, $2,720, $2,650
- Resistance: $3,000, $3,120, $3,250, $3,350
The price is trading below the 100-hourly Simple Moving Average, indicating a bearish trend.
Momentum Indicators
- Hourly MACD: The MACD is gaining momentum in the bearish zone, suggesting further downside potential.
- Hourly RSI: The RSI is below the 50 zone, signifying weak buying momentum.
Potential Scenarios
- Breakout Above Resistance: A decisive break above $3,000 could signal a trend reversal, with potential targets at $3,120 and $3,250. However, overcoming the bearish trend line at $3,000 will be a crucial hurdle.
- Breakdown Below Support: A drop below $2,800 could lead to further losses towards $2,720 and $2,650.
- Check out our free forex signals
- Follow the top economic events on FX Leaders economic calendar
- Trade better, discover more Forex Trading Strategies
- Open a FREE Trading Account
