Spending Falls in Japan, USDJPY Supported After the 1-Cent Dip
USDJPY's move above the 160.00 level and the establishment of a support zone around 160.20 underscores the pair's bullish momentum.
USDJPY’s move above the 160.00 level and the subsequent establishment of a support zone around 160.20 underscores the pair’s bullish momentum. While the recent contraction in US ISM services data briefly disrupted this trend, the support above the 50 SMA indicates a potential for continued upward movement. Buyers will focus on sustaining this momentum, while sellers will watch for any signs of a breakdown below key support levels to shift the trend.
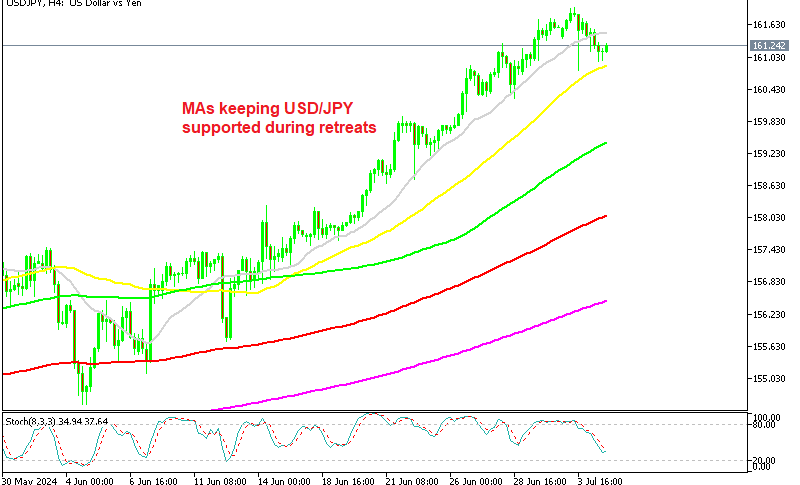
USD/JPY Chart H4 – MAs Keeping It Supported During Dips
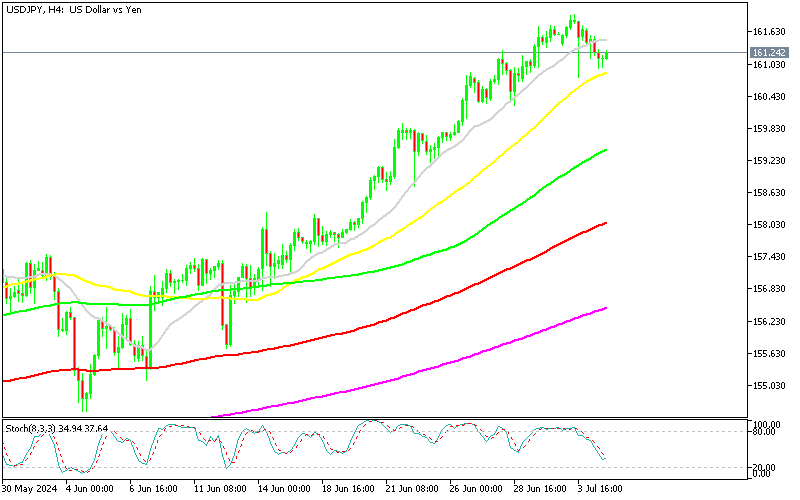
USD/JPY has surged past the critical 160.00 level, driven by the lack of intervention from Japanese authorities, which has bolstered market confidence in reaching new highs. Last week, the pair dipped to the 160.00 level but quickly rebounded as buyers stepped in around 160.20, suggesting that this area has now established itself as a significant support zone. A minor trendline has formed on the 4-hour chart, with the 20 SMA (gray) highlighting strong buying pressure.
Despite this, the 20 SMA was breached yesterday following disappointing US ISM services data, which indicated a contraction in the sector for June. This news caused the pair to drop 100 points, falling below 161. The decline halted just above the 50 SMA (yellow), initiating a bullish reversal. Buyers are likely to rely on the 50 SMA to maintain upward momentum and push towards new highs. The recent rebound above the 50 SMA adds to the bullish outlook, suggesting that the market is ready to test higher levels.
Japanese Household Spending Report for June
USD/JPY Live Chart
- Check out our free forex signals
- Follow the top economic events on FX Leaders economic calendar
- Trade better, discover more Forex Trading Strategies
- Open a FREE Trading Account
- Read our latest reviews on: Avatrade, Exness, HFM and XM
Related Articles


Sidebar rates
Related Posts
