WTI Crude Oil Price Forecast: $75.50 Amid China’s Slowdown & Venezuelan Uncertainty
WTI Crude Oil Price Forecast shows that oil prices are currently trading at $75.51, continuing their downward trend. This bearish movement

WTI Crude Oil Price Forecast shows that oil prices are currently trading at $75.51, continuing their downward trend. This bearish movement is influenced by a variety of factors, including recent economic data and geopolitical developments.
China’s Economic Slowdown Weighs on Oil Prices
WTI Crude Oil has faced pressure due to disappointing economic indicators from China. Manufacturing activity is projected to contract for a third consecutive month in July, and Citi has reduced China’s growth forecast to 4.8% from 5% following weaker-than-expected second-quarter results. This slowdown raises concerns about decreased oil demand from the world’s largest importer.
Geopolitical Stability Helps Limit Losses
Despite escalating tensions in the Middle East, oil prices have stabilized. Recent statements from Israel regarding a restrained response to Hezbollah’s actions and U.S. diplomatic efforts to prevent further escalation have helped mitigate market fears.
Venezuelan Political Uncertainty Adds Supply Concerns
The Venezuelan political situation, with the opposition claiming a significant electoral victory against incumbent Nicolás Maduro, could impact global oil supply. Potential tightening of U.S. sanctions might reduce Venezuela’s exports by 100,000-120,000 barrels per day.
WTI Crude Oil Price Forecast : Technical Outlook
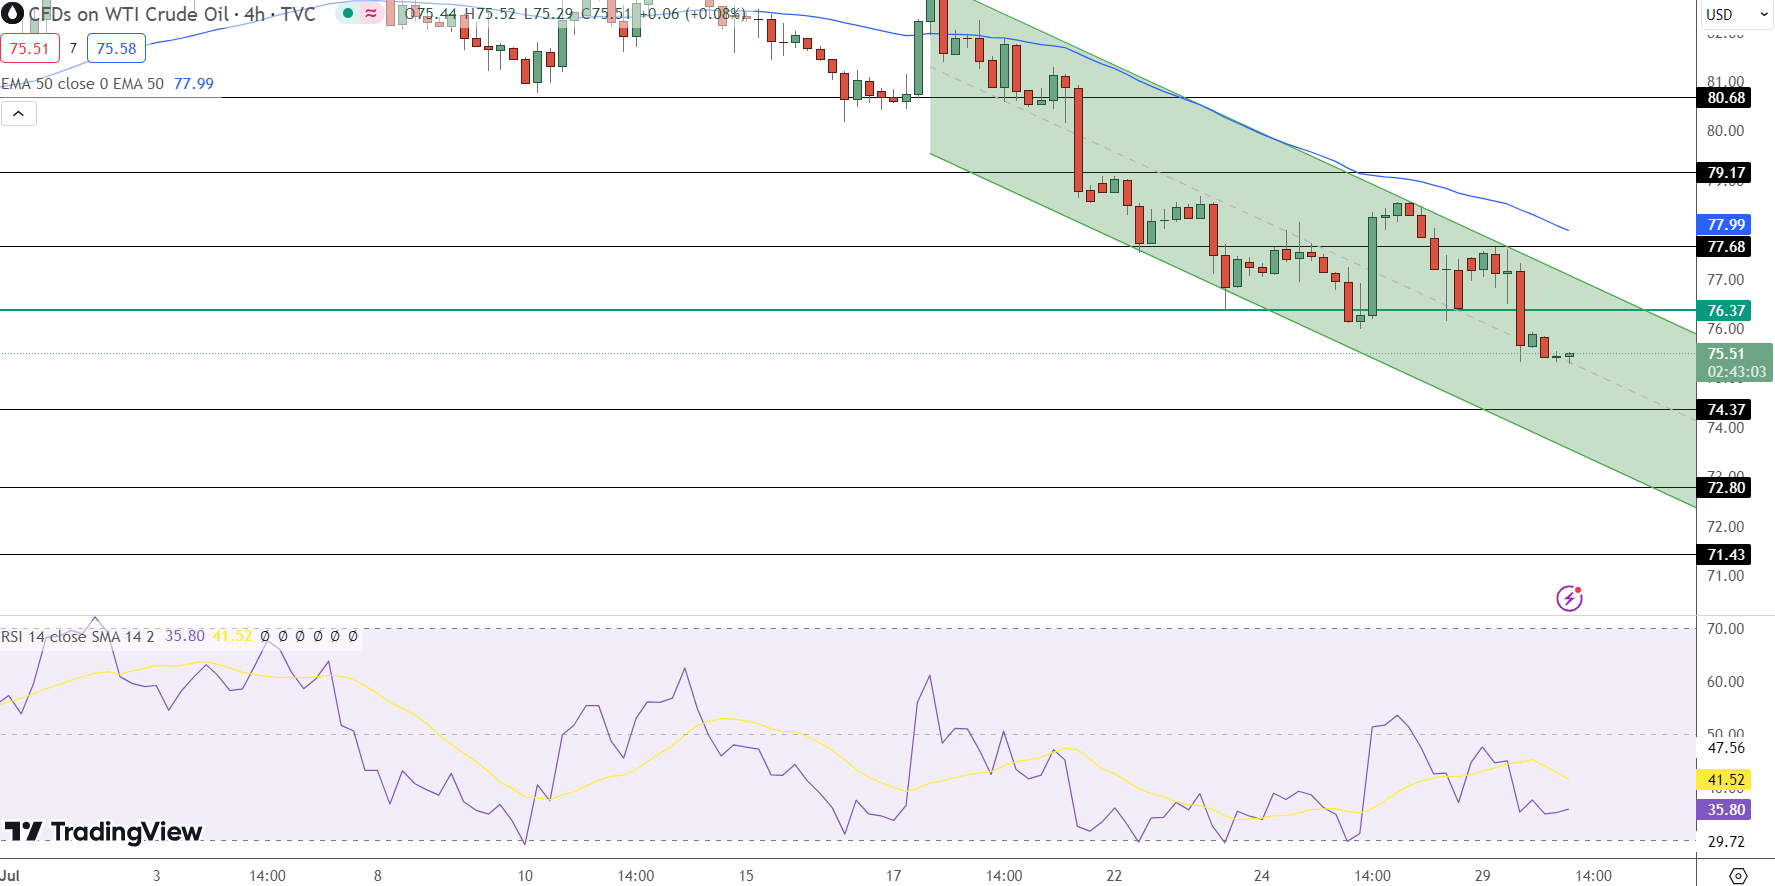
WTI Crude Oil (USOIL) is currently trading at $75.51 within a downward channel, indicating a bearish trend. The pivot point is at $76.35, which serves as a critical resistance level. Immediate resistance is noted at $76.37, with further resistance levels at $77.68 and $79.17. On the downside, immediate support is found at $74.37, followed by $72.80 and $71.43.
Technical indicators provide additional context to the market conditions. The Relative Strength Index (RSI) is at 41.52, suggesting neutral conditions with a slight bearish bias. The 50-day Exponential Moving Average (EMA) is positioned at $77.99, offering significant resistance to any upward movement.
The current downward channel implies continued bearish pressure, with potential declines if prices fall below $74.37. However, a break above the $76.35 pivot point could shift the market sentiment to bullish, targeting higher resistance levels.
- Check out our free forex signals
- Follow the top economic events on FX Leaders economic calendar
- Trade better, discover more Forex Trading Strategies
- Open a FREE Trading Account
- Read our latest reviews on: Avatrade, Exness, HFM and XM
Related Articles


Sidebar rates
Related Posts
