Bitcoin Shattered, Even With Strength: Will BTC Hold Above $50,000?
Bitcoin is under pressure. Unless BTC breaks $60,000, the coin might sink lower, dropping below the psychological round number at $50,000

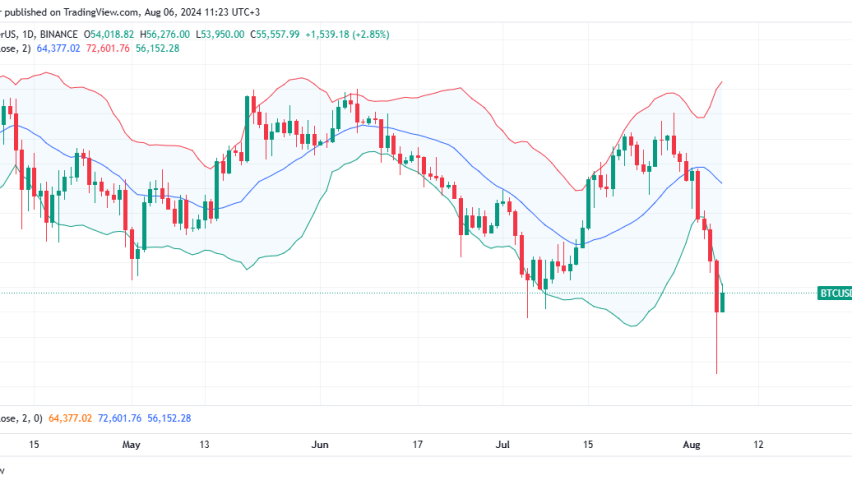
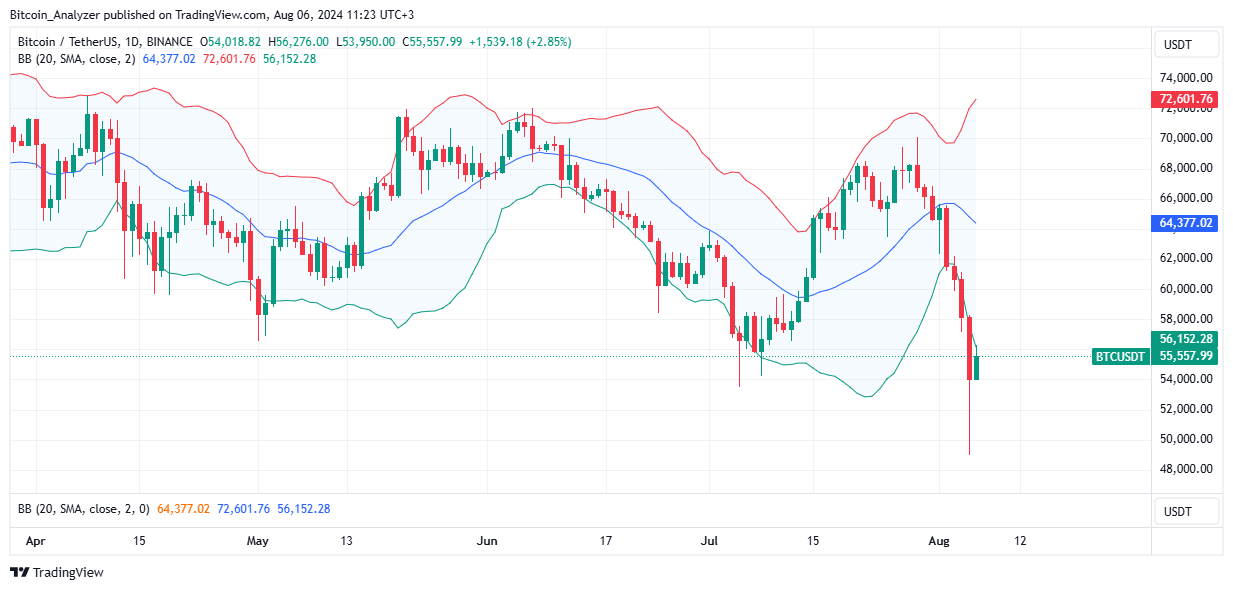
Bitcoin pushed higher in the closing hours of August 5 to end with a long lower wick. Even though there is general optimism that yesterday’s drop was climactic, how price action performs today will be crucial. In the immediate term, bears have the upper hand, and the highs of the high-volume bear bar of August 5 will act as the local resistance for optimistic bulls. If the downtrend continues, the first stop would be $50,000 and later $40,000 in a bear trend continuation formation.
From the daily chart, it is clear that sellers are in control. By the first part of the trading session, Bitcoin was down nearly 30% from July highs and at risk of crashing even harder. So far, losses have been contained. Although sellers are slowing down, the drop over the past week is in double digits, sinking by over 16%. Meanwhile, trading volume is skyrocketing, surging to over $75 billion.

The following Bitcoin news events are worth tracking:
- Yesterday, BTC fell to as low as $49,000 before bouncing back. Though sellers are still in charge and the coin is in a bear breakout formation, one analyst thinks BTC is cheap, reading from the 90-day market versus the realized price gradient oscillator.
- Bitcoin has been shattered, and the downtrend is clear at spot rates. Even so, once prices drop below $48,000, the coin risks falling even harder, possibly to $40,000, in a bear trend continuation formation.
Bitcoin Price Analysis
The path of least resistance is southwards.
The August 5 bar closed with a long lower wick, pointing to strength.
Still, even with the bounce in the [[BTC/USD]] chart, sellers might consider dumping on every attempt higher but below $58,000.
The first local support and target is $50,000 and $48,000.
On the upper end, if prices float above $60,000, Bitcoin might print higher, retesting $66,000 in a welcomed recovery.
- Check out our free forex signals
- Follow the top economic events on FX Leaders economic calendar
- Trade better, discover more Forex Trading Strategies
- Open a FREE Trading Account


