Forex Signals Brief August 19: Powell and PMIs Highlight the Week
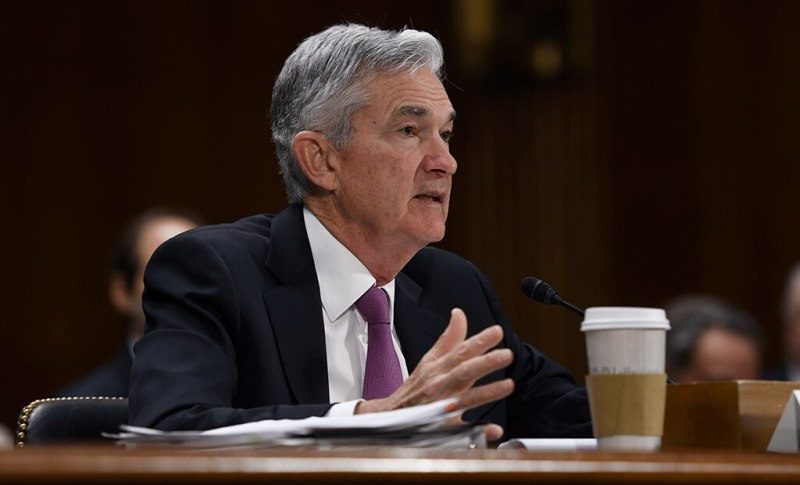
The economic calendar is light until Thursday when we have the manufacturing and services PMIs, followed by Powell on Friday.

Last week the attention was on the US inflation figures for July, although the RBNZ surprised markets as they delivered an unexpected rate cut of 25 basis points, which left the Kiwi softer compared to other risk currencies. However, NZD/USD ended the week higher, as markets continue to remain bearish on the USD.

The PPI producer inflation report on Tuesday showed a considerable slowdown, which will affect FED’s favorite PCE inflation report later this month. The Consumer Price Index (CPI) report on Wednesday also showed a slowdown in prices, but wasn’t as steep. As a result, the USD ended the day higher.
On Thursday, the retail sales report showed a nice jump of 1% in July, which confirmed that the US consumer is not feeling too bad. Besides that, the Unemployment Claims declined again, which also confirmed that the US employment market is in decent shape, however the USD retreat resumed on Friday, which left the USD the weakest currency for the week.
This Week’s Market Expectations
The CPI inflation report from Canada is the only event on the first half of this week’s nearly empty economic calendar. However, Thursday will be the start of it, with the US and UK PMIs numbers as the primary highlights and the Flash PMIs Day for other important economies, including the Eurozone. The week will culminate and be highlighted on Friday when Fed Chair Powell speaks at the Jackson Hole Symposium.
Upcoming Forex Events for the Week:
Monday:
- New Zealand Services PMI
Tuesday:
- People’s Bank of China Loan Prime Rate (PBoC LPR)
- RBA Meeting Minutes
- Canada CPI
Wednesday:
- FOMC Meeting Minutes
Thursday:
- Flash PMIs for Australia, Japan, Eurozone, UK, and US
- ECB Meeting Minutes
- US Unemployment Claims
- Jackson Hole Symposium begins
Friday:
- New Zealand Retail Sales
- Japan Core CPI
- Canada Retail Sales
- Fed Chair Powell speech at Jackson Hole Symposium
Last week the volatility remained high as markets reversed a couple of times after the soft US inflation data, then following the stronger retail sales and unemployment claims figures. However, risk assets kept progressing, with stock market indices reaching new record highs, as did Gold. We opened 23 trading signals in total, ending the week with 16 winning forex signals and 7 losing ones..
Gold Fails at Record High Again
Gold prices have shown a strong upward trend, with every dip being met by buyer control, increasing the likelihood that the recent breakout might continue. The global demand for gold remains a key factor in this price surge. In particular, India has seen a slight increase in physical gold purchases due to price adjustments, while in China, rising premiums signal growing demand for gold as a safe-haven asset. On Friday, gold (XAU/USD) surged to a new all-time high of $2,500, surpassing the previous peak of $2,483.74 set in July. This rise was primarily driven by the weakening US dollar and a decline in US housing starts and building permits.
XAU/USD – Daily chart
AUD/USD Heads for 0.67
The Australian dollar (AUD/USD) experienced a significant recovery after hitting a new low for 2024 at 0.6350 on Monday. By Tuesday, the pair had climbed above 0.66, returning to a more stable range. This recovery was supported by the Reserve Bank of Australia’s (RBA) decision to maintain its current policy stance, with Governor Bowman confirming that there had been no discussion of lowering interest rates. The stability of the RBA’s policy has bolstered the Australian dollar, particularly as it remains one of the few major central banks not to cut rates.
AUD/USD – Daily Chart
Cryptocurrency Update
Bitcoin Sticks to $60k for the Moment
Bitcoin saw a sharp decline by midweek, dropping nearly 3% to the $57,700 range, which led to significant losses across the broader cryptocurrency market. Earlier in the week, Bitcoin had briefly surged to $61,830, fueled by optimism surrounding Bitcoin exchange-traded funds (ETFs) and major investments from large financial institutions like MicroStrategy. Despite these gains, Bitcoin’s price remains volatile, hovering around the $60,000 mark.
BTC/USD – Daily chart
Ethereum Climbs Above the 20 Daily SMA
Ethereum has been in a downward trend since March, marked by lower highs, indicating the possibility of further declines in August. In June, Ethereum’s price fell from a high of $3,830 to below $3,000. Although buyer pressure pushed the price above the 50-day SMA, another bearish reversal occurred due to selling pressure. This continued downtrend drove Ethereum’s price below the 200-day SMA. Yesterday, Ethereum hit a low of $2,000 but quickly rebounded above $2,600, breaking through the 20-day SMA.
ETH/USD – Daily chart
- Check out our free forex signals
- Follow the top economic events on FX Leaders economic calendar
- Trade better, discover more Forex Trading Strategies
- Open a FREE Trading Account


