Forex Signals Brief August 29: Awaiting the US GDP and Unemployment Claims
Today attention will shift on the economic data, as traders await the US prelim Q2 GDP report and the Unemployment Claims.

Markets remained cautious yesterday, similar to the run-up to Powell’s speech last Friday. This led to a pattern of buying the US dollar and selling off sick assets such as the Euro and stocks, as investors braced for Nvidia’s earnings report. Earlier in the Asian session, the Australian CPI inflation data showed a slower pace of decline than expected, which gave the Australian dollar a slight boost.

Meanwhile, oil prices saw significant movement, dropping over $2 during the European session before recovering most of those losses. In the US session, the five-year Treasury auction was slightly underwhelming, even with some pre-auction concessions. There was a brief period of US dollar selling into the London fix as the month came to a close, but this trend quickly reversed. Dollar buying resumed later in the day, intensifying as stock markets experienced heavy selling.
However, as stocks began to recover, foreign exchange prices also improved. The cautious trading has resulted in a less oversold dollar, setting the stage for further developments with Nvidia’s earnings and tomorrow’s initial unemployment claims report. After the US markets closed, Nvidia reported better-than-expected second-quarter earnings, with earnings per share (EPS) of $0.68 versus the expected $0.64, and revenue of $30.04 billion compared to the forecasted $28.5 billion. Nvidia also projected continued growth into the third quarter, which could provide additional market direction.
Today’s Market Expectations
In the European session we have the CPI (Consumer Price Index) inflation numbers from Germany for August, which expected to fall flat, down from the 0.3% jump in July which was a bit of a surprise. But, if the data comes as expected, the July’s number will be written off and we’ll be back on the softening inflation trend.
The US Jobless Claims report is one of the most significant weekly economic releases, offering a timely indication of the labor market’s health. It provides insights into both initial jobless claims, which measure new unemployment filings, and continuing claims, which track the number of people who remain unemployed and are still receiving benefits. Since 2022, initial jobless claims have consistently stayed within the 200,000 to 260,000 range. This stability suggests that layoffs have not accelerated and remain relatively low. Meanwhile, continuing claims have been steadily rising, indicating that while layoffs are low, hiring has also become more moderate. For this week, Initial Jobless Claims are forecasted to be 234,000, slightly up from 232,000 last week. Continuing Claims are expected to rise to 1,870,000, compared to 1,863,000 the previous week. These modest increases suggest a still-resilient labor market, but with signs of gradual softening.
Yesterday we had a great day with forex signals, ending up with a full table of winning forex signals. The price action was slow again, but most markets were directional, so they were relatively easier to trade. We opened 9 trading signals, 7 of which closed by the end of the day, all of which reached the take profit targets.
Gold Retreats to $2,500
Gold hit a new high of $2,531 earlier this week but saw a sharp decline to $2,470 following a $60 drop on Thursday. This pullback was triggered by positive U.S. economic data, including a rebound in home sales, which reversed the previous month’s decline, and a Services PMI that climbed above 55 points, indicating robust growth in the services sector. Despite these strong economic indicators, Fed Chairman Jerome Powell’s dovish stance helped push gold back above $2,500. Buyers regained control, lifting the price to $2,526, but yesterday, gold (XAU) slipped back below the $2,500 mark.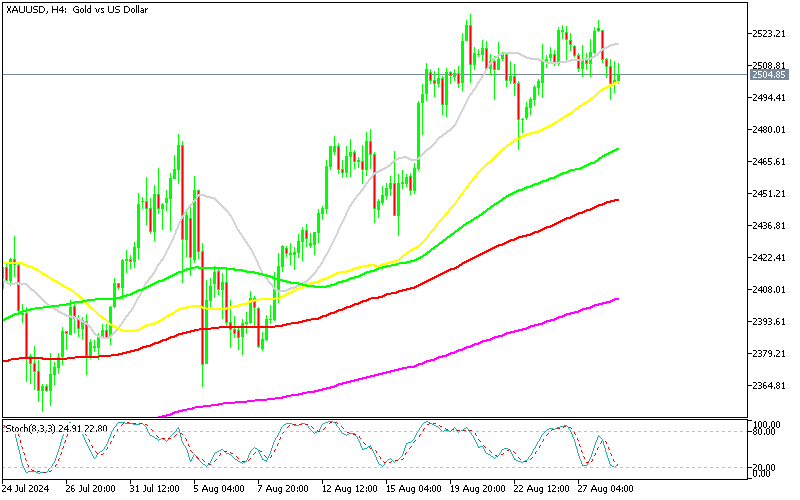
XAU/USD – Daily chart
NZD/USD Slows Below the 100 Weekly SMA
The USD to NZD exchange rate has experienced significant fluctuations, with a 3-cent drop in July followed by a 4-cent increase, eventually stabilizing this week. The recent upward momentum has paused just below the 100 simple weekly SMA (green), suggesting that the bullish trend may be losing steam. This resistance level hints at a potential bearish reversal, as the pair struggles to maintain its upward trajectory. The slowdown in momentum could signal a shift in market sentiment, with traders potentially looking to take profits or adjust positions in anticipation of a reversal.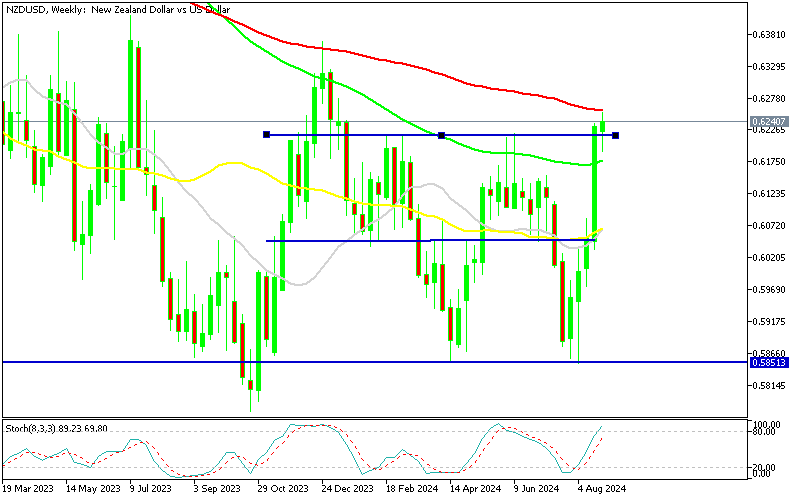
NZD/USD – Daily Chart
Cryptocurrency Update
Bitcoin Slips Below $60K

BTC/USD – Daily chart
Ethereum Dips below $2,500
Ethereum has been in a downtrend since March, with a pattern of lower highs indicating the potential for further declines in August. After a sharp fall from $3,830 to below $3,000, Ethereum saw a temporary recovery above the 50-day SMA in June. However, persistent selling pressure led to another downturn, pushing the price below the 200-day SMA before it managed to rise above $2,600. Currently, buyers are testing the 20-day SMA, setting the stage for a potential showdown between bulls and bears over the market’s future direction. This battle around the 20-day SMA will likely determine whether Ethereum can mount a more sustained recovery or if the downtrend will continue.
ETH/USD – Daily chart
- Check out our free forex signals
- Follow the top economic events on FX Leaders economic calendar
- Trade better, discover more Forex Trading Strategies
- Open a FREE Trading Account
- Read our latest reviews on: Avatrade, Exness, HFM and XM
Related Articles


Sidebar rates
Related Posts
