USDJPY Falls Below 144 After Japanese Earnings
Last week USD/JPY experienced strong buying pressure, climbing above 147. But, the 200-day SMA rejected it, pushing it 300 pips lower.
Last week, USDJPY experienced significant buying pressure, with the pair climbing 3.5 cents to surpass the 147 level. However, the 200-day SMA acted as a strong resistance, rejecting the price and leading to a sharp reversal over the last two days, pushing the pair 300 pips lower.
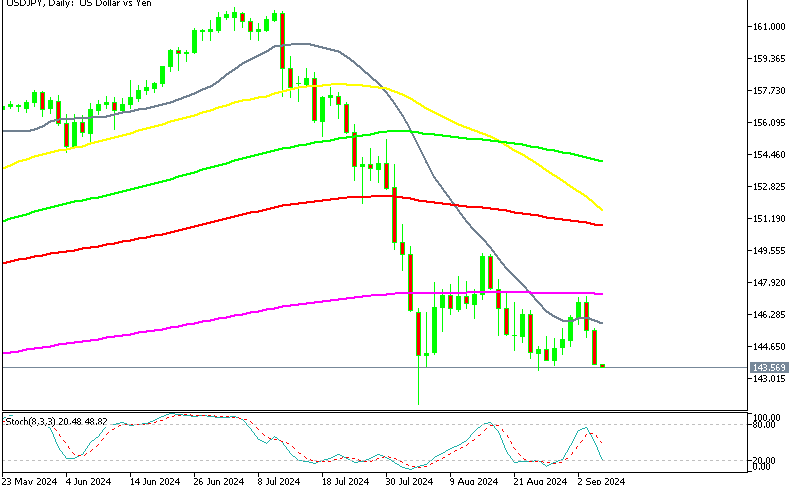
USD/JPY Chart Daily – Rejected by the 200 SMA
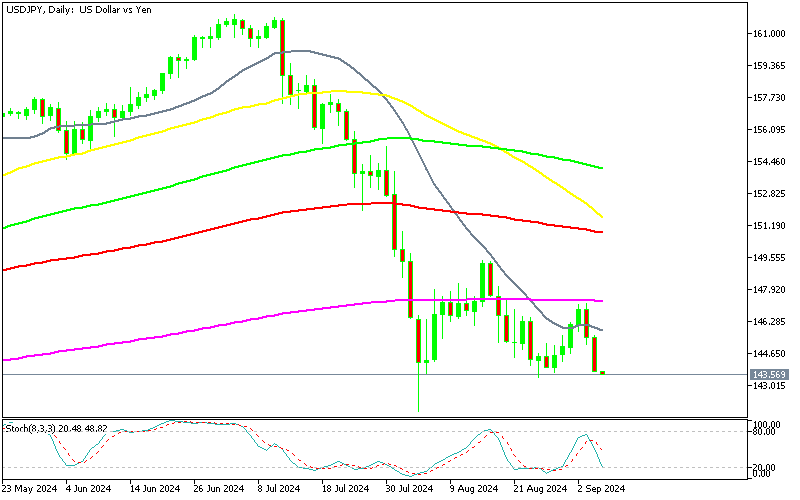
The daily chart shows a pattern of falling highs, reinforcing the overall negative trend. The USD/JPY broke below the 145.40 level decisively, suggesting an initial move towards the 143 area. As long as the pair remains below 145.36, the bearish outlook remains valid on an intraday basis. However, a break above this level could revive the bullish scenario, with the first target being this week’s high at 147.20.
As the trading day comes to a close, the USDJPY is nearing a new session low of 143.50. If prices go below those levels (seen in red numbered circles), traders will look for the August lows at 141.70.Additionally, during the early Asian session, Japan released its Average Cash Earnings report, which revealed a significant 4.5% increase compared to the previous month.
Japan Average Cash Earnings Report for August
- Average Cash Earnings for August increased by 3.6% year-on-year, beating expectations of 2.9%. This represents a slight decrease from the 4.5% reported in the prior month.
- Overtime Pay dropped by 0.1% year-on-year, compared to a 0.9% increase in the previous month, indicating a slowdown in extra compensation for additional work.
- Real Wages, which are inflation-adjusted, rose by 0.4% year-on-year, suggesting that workers’ purchasing power has improved slightly, despite rising inflation pressures.
- The report reflects moderate wage growth, with a slowdown in both overtime compensation and overall earnings compared to the previous month, which could signal potential caution in Japan’s labor market and economic activity.
USD/JPY Live Chart
- Check out our free forex signals
- Follow the top economic events on FX Leaders economic calendar
- Trade better, discover more Forex Trading Strategies
- Open a FREE Trading Account
- Read our latest reviews on: Avatrade, Exness, HFM and XM
Related Articles


Sidebar rates
Related Posts
