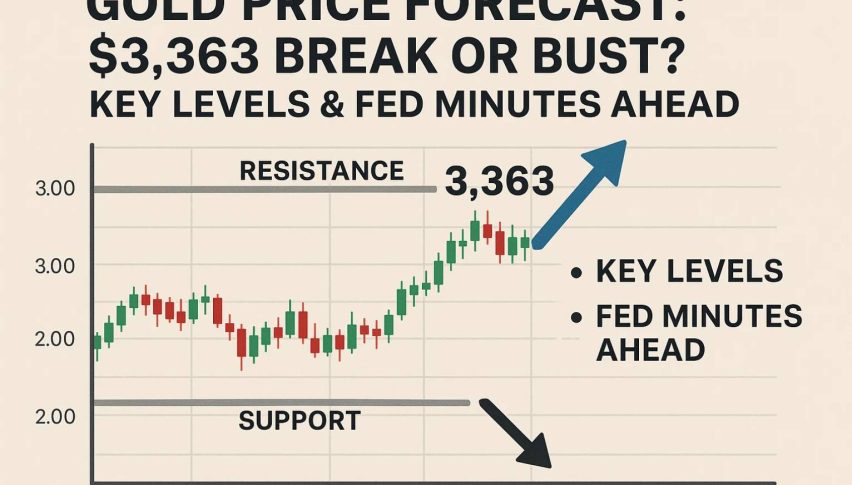
Gold Price Forecast: Key Resistance at $2,500, Geopolitical Tensions Drive Demand
Gold prices (XAU/USD) have shown strength during the Asian session, touching an intra-day high of $2,500, supported by concerns

Gold prices (XAU/USD) have shown strength during the Asian session, touching an intra-day high of $2,500, supported by concerns over the US economy and geopolitical tensions.

Mixed US employment data has lessened the likelihood of a significant 50-basis point rate cut by the Federal Reserve. The Bureau of Labor Statistics (BLS) reported a Nonfarm Payroll (NFP) increase of 142,000 in August, missing the 160,000 forecast.
The unemployment rate fell to 4.2%, while wage inflation rose to 3.8%. Despite weaker job data, the US Dollar (USD) strengthened slightly due to higher Treasury yields, limiting further gold gains.
#Gold Price Forecast: XAU/USD down but not out whilst 21-day SMA holds 💹🌐
Gold price is trading on the front foot just shy of the $2,500 threshold early Monday, consolidating Friday’s late #fx #gold #XAUUSD #NAS100 #forex #GBPUSD #EURUSD pic.twitter.com/7FNhJvdTmL
— Gracy Nair (@GracyNair14) September 9, 2024
Geopolitical Tensions and Their Effect on Gold Demand
Ongoing tensions between Israel and Hamas have increased demand for gold as a safe-haven asset.
With ceasefire talks stalling, investor interest in riskier assets has waned, pushing gold prices higher.
China’s steady gold holdings at 72.8 million fine troy ounces and its mixed inflation data have had minimal impact on the market.
Meanwhile, the conflict in Gaza, including disruptions to essential services and education for 630,000 students, continues to influence market sentiment.
Gold appears to be facing some headwinds as markets prepare for a likely 25-basis-point interest rate cut from the Federal Reserve following a mixed August nonfarm payrolls report. pic.twitter.com/FebxTnAlfO
— Metalex Gold (@MetalexCo) September 7, 2024
Technical Outlook: Gold’s Key Price Levels
Gold is currently trading just above the $2,485 support level, a key area determining its short-term direction. Immediate resistance stands at $2,502, marked by the 50-day Exponential Moving Average (EMA).
A break above this level could see gold testing the next resistance at $2,522. However, failure to maintain above $2,485 may lead to a decline toward support levels at $2,472 and $2,458.
- Immediate Resistance: $2,502
- Immediate Support: $2,485
- RSI: 42 (suggests mild bearish pressure)
- 50-day EMA: $2,502

Conclusion
Gold’s near-term trend remains within a consolidation range. A break above $2,502 could open the door for a bullish move, while a slip below $2,485 might trigger further declines. Traders should closely monitor these key levels.
- Check out our free forex signals
- Follow the top economic events on FX Leaders economic calendar
- Trade better, discover more Forex Trading Strategies
- Open a FREE Trading Account


