Forex Signals Brief September 13: Light Calendar, Mind China Data Tomorrow
Today the economic calendar is pretty light, but we have some important economic releases from China tomorrow to keep an eye on.

Yesterday the ECB policy meeting highlighted the day, as they delivered another 25 bps rate cut. However, the Euro stood its ground, with EUR/USD finding support at 1.10 and moving higher in the US session. The European Central Bank (ECB) delivered the anticipated rate cut, but President Lagarde refrained from committing to any specific future rate path.

While growth forecasts were revised slightly lower, inflation expectations for 2024 and 2025 were raised marginally. Later on, reports from “ECB sources” indicated that an October rate cut is unlikely, and any reduction in December would depend on further signs of economic slowdown. This news seemed to support the EURUSD until the market closed.
In the US, initial jobless claims matched expectations, but the Producer Price Index (PPI) presented mixed results. Initially, market sentiment held steady, maintaining the view that the Federal Reserve would opt for a 25 basis point rate cut. However, Wall Street Journal’s Timiraos later posted some analysis exploring the Fed’s dilemma over whether to cut rates by 25 or 50 basis points, which could help keep inflation on a downward trend.
In a separate post, PPI and CPI analysts estimated core PCE to fall between 0.13% and 0.17%, boosting optimism in the market for a potential 50 basis point cut from the Fed. This sentiment, combined with risk-on market behavior and economic data, contributed to a weakening USD and rising risk assets like stocks and risk-sensitive currencies. For the fourth consecutive day this week, the S&P and Nasdaq indices closed higher, recovering most of the losses from the previous week, which saw declines of -4.25% and -5.77%, respectively.
Today’s Market Expectations
Today the economic calendar is light, with some minor releases such as the BusinessNZ Manufacturing Index which was released during the Asian session. New Zealand’s Manufacturing PMI for August came in at 45.8, up from the previous 44.4 (revised from 44.0). Despite the slight improvement, the PMI remains below the long-term average of 52.6, indicating the sector has been contracting for 18 straight months.
Later in the US session we have the US University of Michigan Consumer Sentiment Index which is expected to come in at 68.0 points, slightly higher than the previous figure of 67.9 points. While the change is minimal, this indicator will be closely monitored by the market, particularly in the current environment where growth is a key focus. Consumer sentiment often serves as a critical signal during business cycle turning points, and any significant deviation from expectations could influence market sentiment and economic forecasts. Investors and analysts alike will be watching closely to gauge consumer confidence and its potential impact on future spending and economic activity.
However, tomorrow we have some important economic releases from China, such as Retail Sales, Industrial Production, New Home Prices, Fixed Asset Investment ytd/y etc, all of which are expected to show further slowdown. If that’s the case, then on Monday risk sentiment will turn negative again.
Yesterday we had another market reversal, particularly in forex, as risk currencies were bearish during the European session, but turned hawkish in the US session as risk sentiment improved on stable US employment and higher core PPI inflation. Traders got caught on the wrong foot. We also got caught during that move but nonetheless, we ended the day in breakeven with three winning and three losing signals.
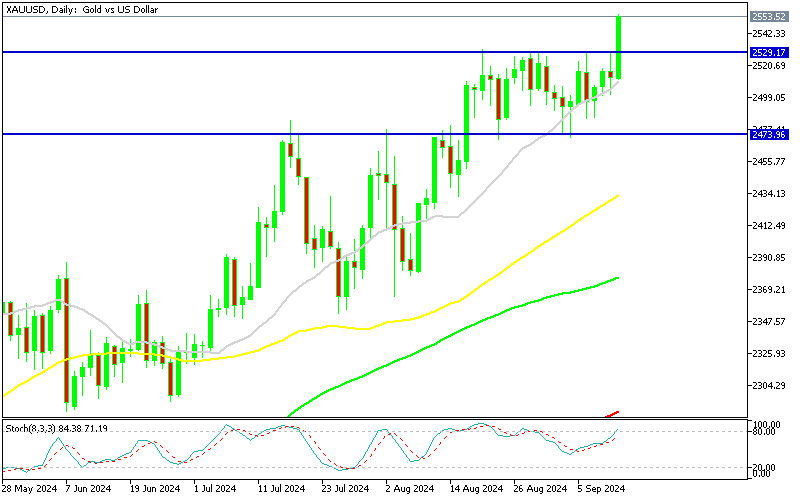
Gold Holds Above the 20 Daily SMA
Gold prices have been fluctuating between $2,470 and $2,531 since mid-August, with higher lows indicating potential further gains. The frequent testing of resistance pointed to a possible bullish breakout, which materialized today as strong buying momentum pushed the price above the upper resistance zone. This suggests that gold could continue its rise, with the previous resistance now likely turning into a support zone.
XAU/USD – Daily chart
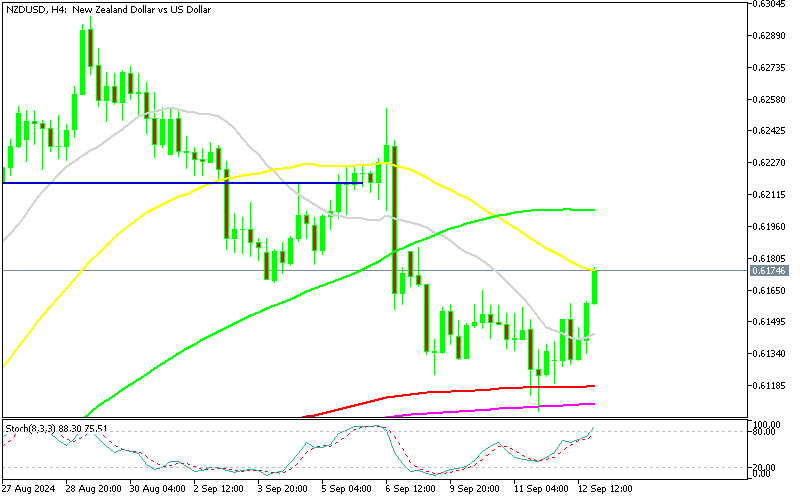
NZD/USD Bounces Off 0.61 Support Zone
In the forex market, the H4 technical chart for NZD/USD showed that buyers were firmly defending the 0.61 level, as the price consolidated around the moving averages, which acted as support. NZD buyers pushed the pair up to the 50 SMA (yellow), signaling a bullish reversal, with a doji candlestick formation reinforcing this shift.
NZD/USD – H4 Chart
Cryptocurrency Update
Bitcoin Continues to Climb Higher Toward $60K Again
In early August, Bitcoin saw a strong rebound, climbing from its lows to $62,000 and nearing $65,000, but encountered solid resistance at the 200-day and 100-day SMAs. This week, Bitcoin formed an inverted pin bar, which could signal a potential trend reversal. Although the price briefly found support above $50,000, buyers stepped in, pushing it back above the key $57,000 level, highlighting ongoing market interest at this region.
BTC/USD – Daily chart
Ethereum Bounces Off the Support
Ethereum, on the other hand, has been in a downtrend since March, consistently setting lower highs, suggesting further declines. After a sharp fall from $3,830 to below $3,000, Ethereum had a short-lived recovery in June, climbing past its 50-day SMA. Despite this, continued selling pressure drove the price down to $2,200. However, Ethereum found strong support at this level, and a recent series of three consecutive bullish daily candlesticks suggests renewed buyer interest.
ETH/USD – H4 chart
- Check out our free forex signals
- Follow the top economic events on FX Leaders economic calendar
- Trade better, discover more Forex Trading Strategies
- Open a FREE Trading Account


