Bitcoin Breaks $62,000, Signaling Potential for Further Gains
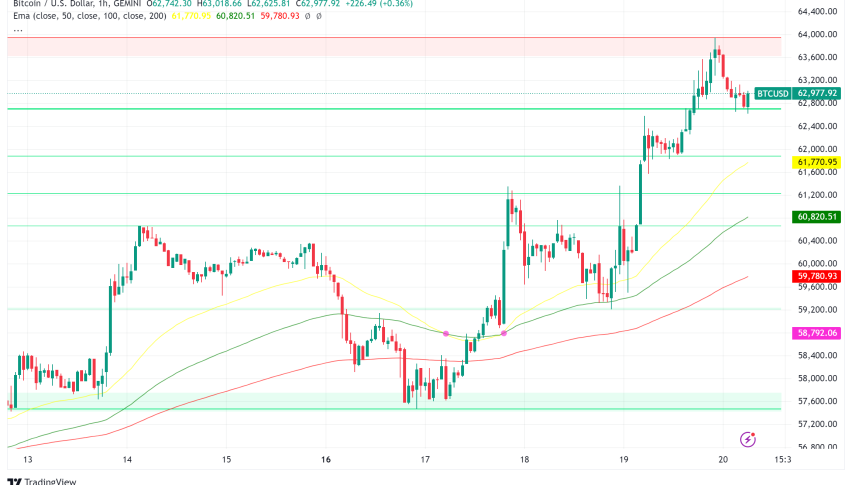
Bitcoin (BTC) has surged above $62,000 on September 19, breaking through a key psychological barrier and its short-term holder (STH)


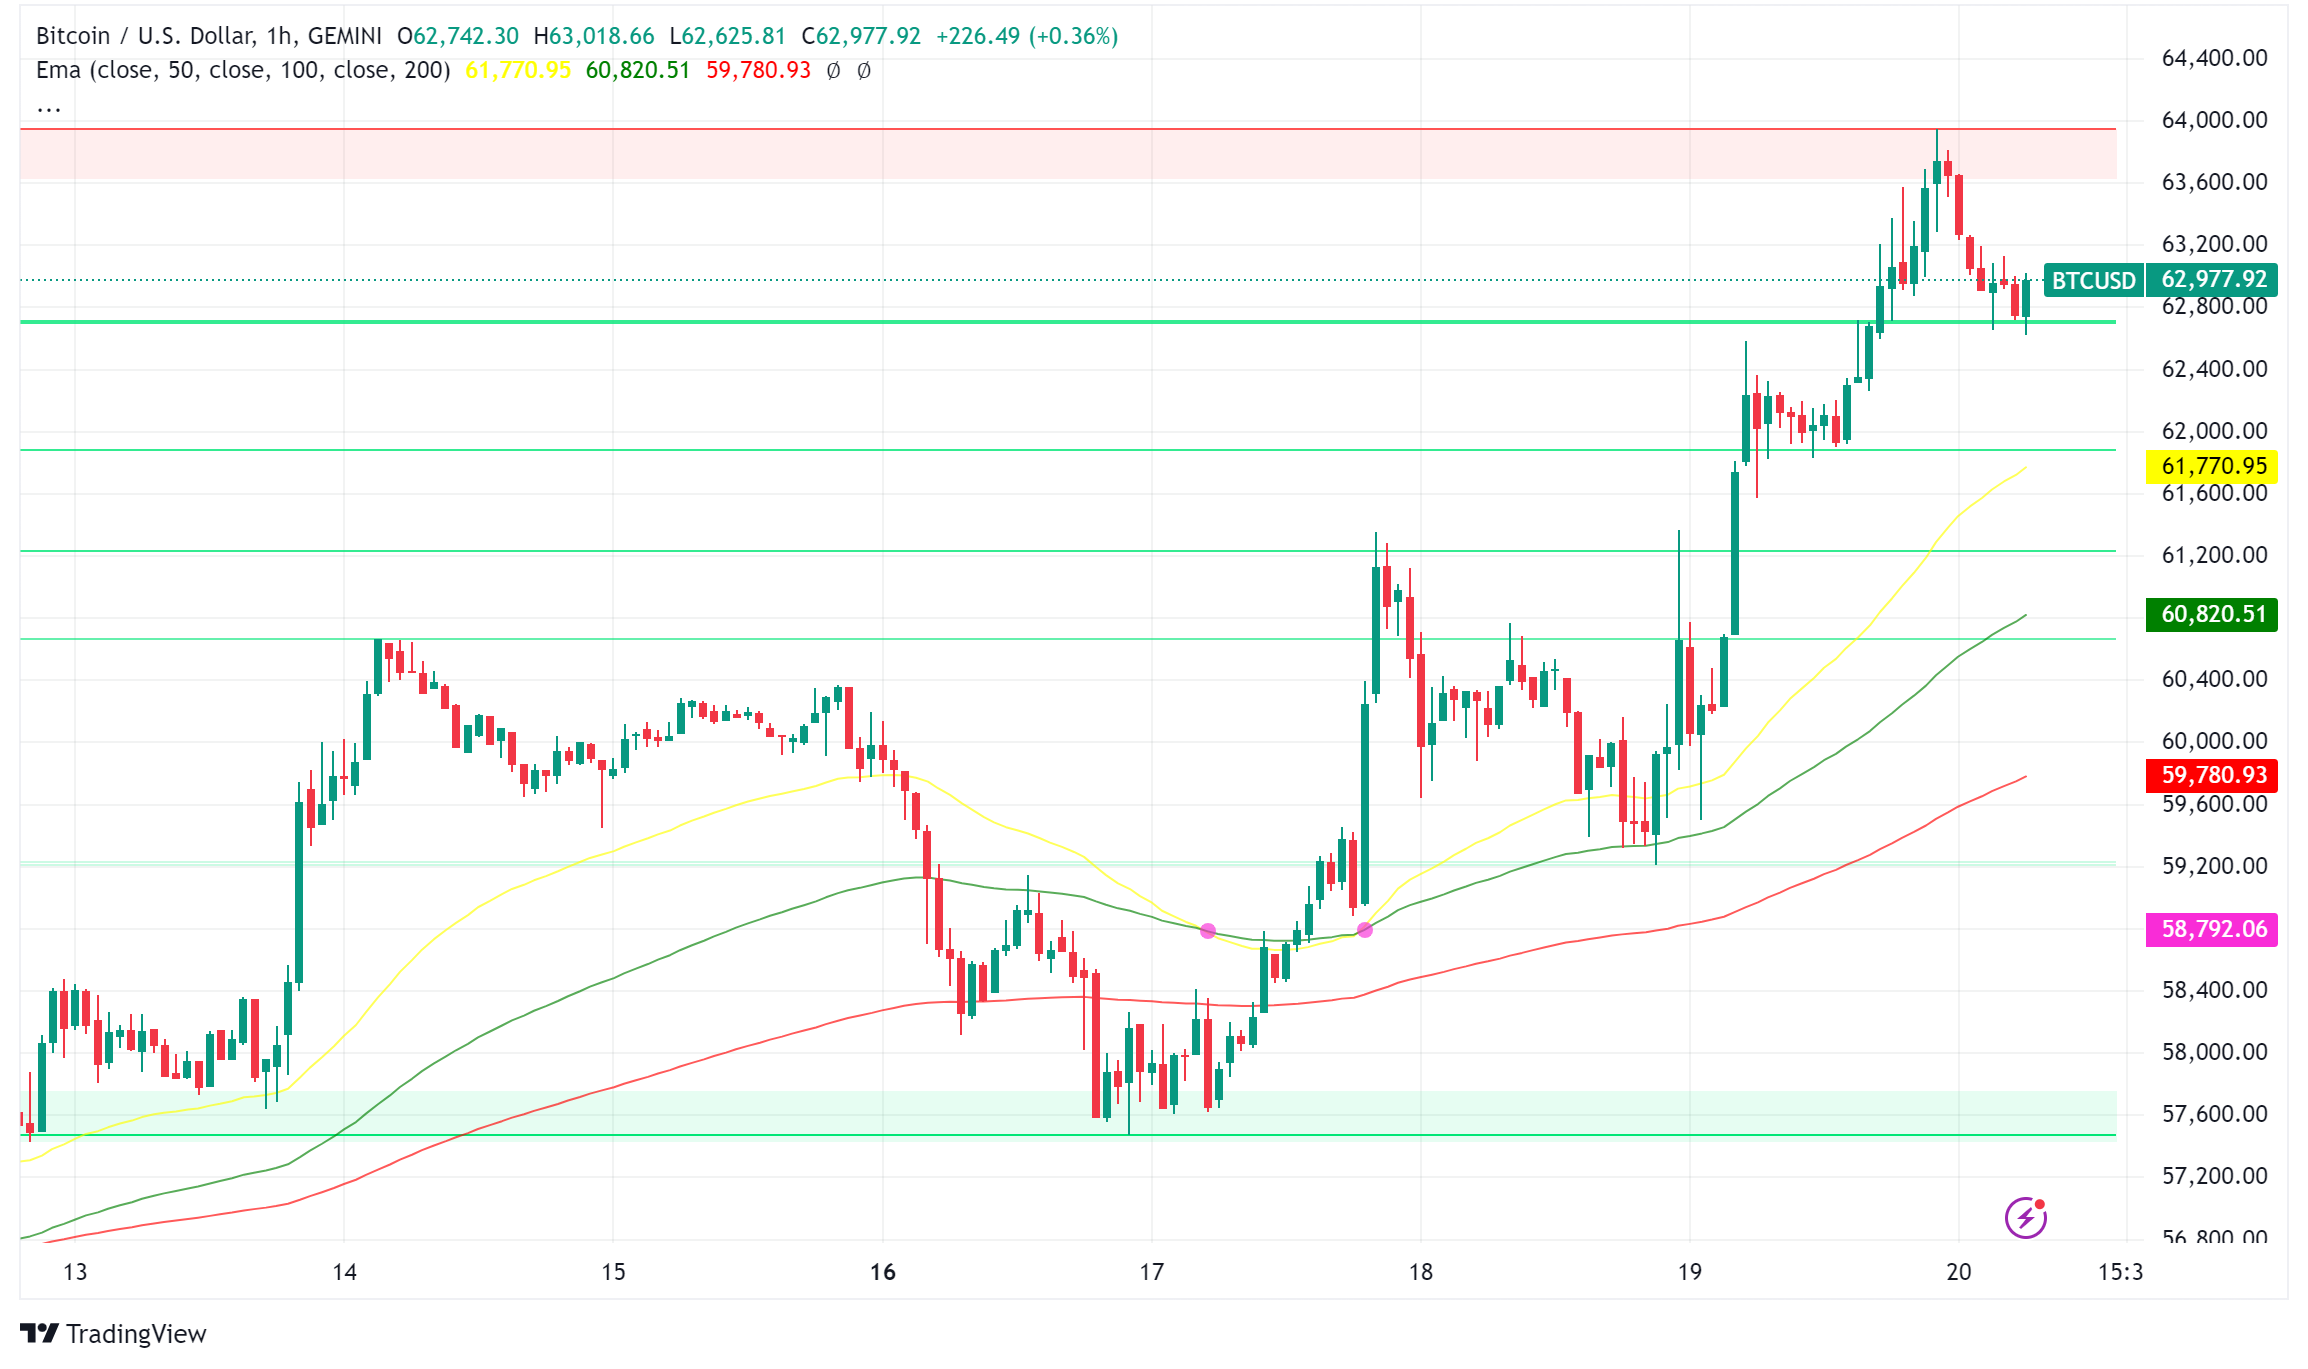
Bitcoin (BTC) has surged above $62,000 on September 19, breaking through a key psychological barrier and its short-term holder (STH) realized price. This breakthrough has sparked optimism among analysts and traders, who see potential for further gains in the world’s largest cryptocurrency.
Short-Term Holder Realized Price: A Critical Metric
The STH realized price, currently at $61,953, represents the average price at which investors who have held their coins for less than 155 days purchased their Bitcoin. This metric has historically served as a crucial support and resistance level for BTC’s price movements.
CryptoQuant analyst Avocado_onchain emphasized the importance of this metric, stating, “The average buy price of these 1-3 month short-term holders is a key onchain metric to monitor, as it can determine the future direction of Bitcoin’s price.”
At the time of writing, Bitcoin was trading at approximately $63,855, about 1.4% above the STH realized price, according to data from CryptoQuant.
Market Sentiment and Support Levels
The recent price action has bolstered positive sentiment in the market. Popular analyst Ercan Sak noted, “If Bitcoin makes daily closings above this level, the market will continue to be positive.” This view was echoed by pseudonymous analyst Coiner-Yadox, who suggested that the “bull market resumes when BTC gets back above” the STH realized price.
Data from IntoTheBlock’s In/Out of the Money Around Price (IOMAP) model indicates strong support in the $61,625 to $63,510 range, where approximately 421,820 BTC were previously purchased by over 2.45 million addresses.
Bullish Indicators and Historical Patterns
Several other indicators are pointing towards a potentially bullish trend for Bitcoin:
- Taker Buy Sell Ratio: This metric on centralized exchanges has spiked from 0.93 on September 14 to 1.052 on September 16, indicating strong buy-side pressure.
- Historical Performance: Despite recent corrections, Bitcoin is still up 290% from its November 2022 market bottom, in line with previous bull market cycles.
- Halving Year Patterns: The current price action resembles Bitcoin’s behavior during previous halving years (2016 and 2020), which saw mid-cycle peaks followed by sideways movement before breaking higher later in the year.
Institutional vs. Retail Positioning
Interestingly, there appears to be a divergence in positioning between large traders (whales) and retail investors. Heatmap data from Hyblock Capital shows an increase in long positions among retail traders in the $62,500 to $63,500 range. In contrast, whales have been accumulating short positions below $60,000, suggesting a more cautious approach from institutional players.
Looking Ahead
While the overall sentiment appears bullish, with InspoCrypto rating it 7 out of 10, there are potential challenges ahead. Significant liquidation levels at $60,000 and $64,000 could trigger volatility if tested. Additionally, the divergence between retail and institutional positioning may lead to interesting market dynamics in the coming weeks.
- Check out our free forex signals
- Follow the top economic events on FX Leaders economic calendar
- Trade better, discover more Forex Trading Strategies
- Open a FREE Trading Account


