Gold (XAU) Daily Forecast: Bullish Momentum Aims for $2,650? U.S. GDP Data Ahead
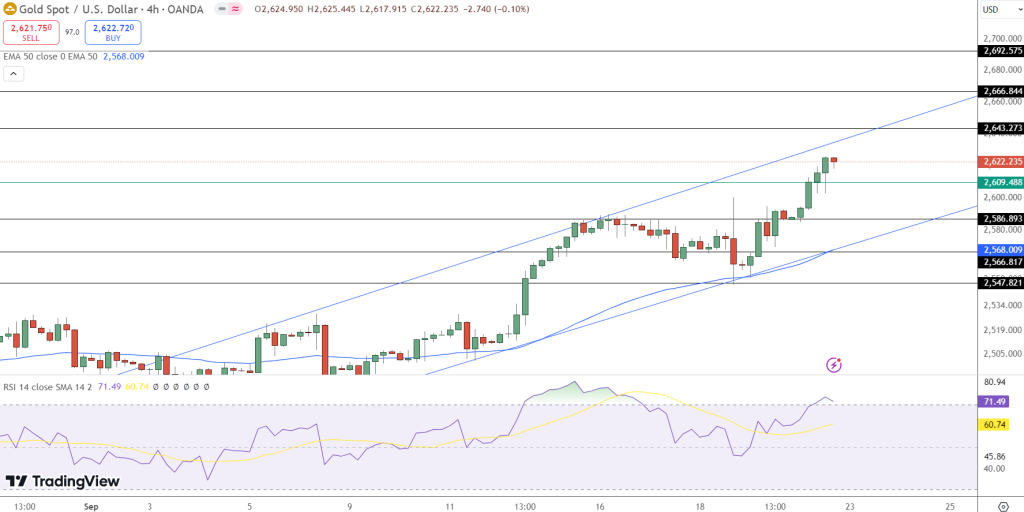
Gold (XAU) remains bullish, trading at $2,622 with resistance at $2,635. RSI suggests potential consolidation, while key support holds...
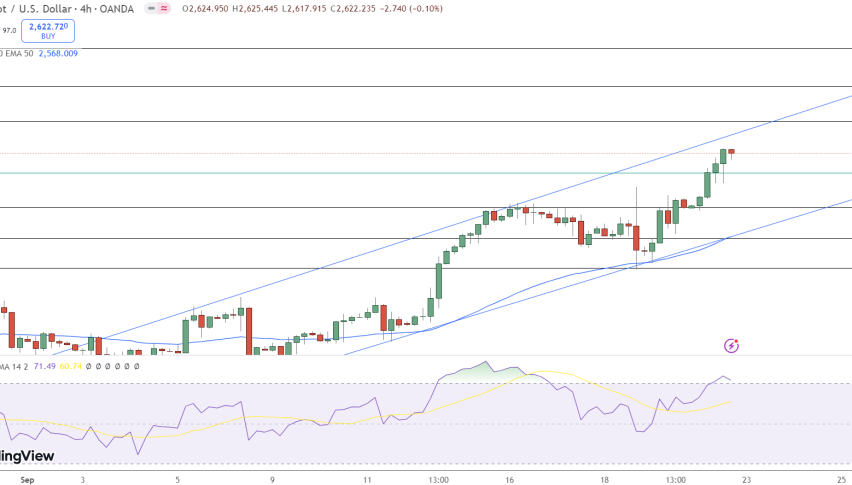
Gold (XAU/USD) remains in a solid bullish trend, closing near $2,622 after reaching an intraday high of $2,625.
The precious metal continues to benefit from global economic uncertainties and safe-haven demand, with the U.S. Federal Reserve’s recent stance on interest rates adding fuel to the upward momentum.
A break above the $2,609 pivot point has set Gold on a path toward immediate resistance at $2,635.
If prices can sustain this momentum, the next key target lies at $2,666, with the $2,692 mark within reach for a more extended rally.
The 4-hour chart also reflects a well-established upward channel, indicating continued strength in the precious metal.
Meanwhile, economic data such as the Flash Manufacturing PMI (forecast at 48.6) and Flash Services PMI (forecast at 55.3) may influence investor sentiment toward the U.S. dollar, indirectly impacting Gold’s trajectory.
Key Economic Events and Impact on Gold
This week brings several crucial U.S. economic indicators that could shape Gold’s price movements.
On Tuesday, the S&P/CS Composite-20 HPI y/y is expected to show a decline to 5.9%, signaling a slowdown in home price appreciation, which could boost safe-haven assets like gold.
Key U.S. economic events this week could drive #Gold prices. Watch for the S&P/CS HPI, Richmond Manufacturing Index, New Home Sales, Crude Oil Inventories, and Thursday’s GDP and Powell’s speech. Weak data may push Gold higher as investors seek safe-haven assets. #XAU #GoldPrices pic.twitter.com/KieEolh4JA
— Arslan Ali (@forex_arslan) September 22, 2024
The Richmond Manufacturing Index is forecast at -17, still in contraction territory, which would further support the metal’s bullish appeal.
Wednesday’s New Home Sales data (forecast at 693K) and Crude Oil Inventories (-1.6M) are also expected to provide insights into the state of the U.S. economy.
Thursday’s Final GDP q/q, unemployment claims, and Fed Chair Powell’s speech will be key events for traders, potentially adding volatility to gold prices.
Should economic data disappoint or point to a weakening U.S. economy, Gold could see another leg upward as investors seek safety.
Technical Outlook: Watching Resistance and RSI
From a technical perspective, Gold’s immediate resistance lies at $2,635, followed by $2,666 and $2,692. A breakout above these levels could trigger further buying interest.
#Gold remains bullish, trading near $2,622 with immediate resistance at $2,635. Support levels to watch: $2,609 and $2,586. RSI at 71 signals overbought conditions, suggesting potential consolidation or a pullback before the next move. #XAU #TechnicalAnalysis #GoldPrices #Trading pic.twitter.com/gqLW5VEFiY
— Arslan Ali (@forex_arslan) September 22, 2024
On the downside, support is firm at $2,609, followed by deeper levels at $2,586 and $2,568, where the 50-day EMA provides robust backing.
The Relative Strength Index (RSI) is 71, indicating overbought conditions. This may lead to some short-term profit-taking or consolidation.
However, as long as Gold holds above the $2,609 pivot, the broader bullish sentiment remains intact.
Key Insights:
- Immediate Resistance: Gold faces resistance at $2,635, with targets at $2,666 and $2,692.
- Support Levels: Key support lies at $2,609, with deeper levels at $2,586 and $2,568.
- RSI Warning: The RSI at 71 signals potential consolidation or a minor pullback before the next move higher.
Traders should closely monitor U.S. economic data this week, which will be critical in shaping Gold’s price direction.
- Check out our free forex signals
- Follow the top economic events on FX Leaders economic calendar
- Trade better, discover more Forex Trading Strategies
- Open a FREE Trading Account
- Read our latest reviews on: Avatrade, Exness, HFM and XM
Related Articles


Sidebar rates
Related Posts
