Selling Pressure at 1.12 in EURUSD Stages A Comeback As New Home Sales Show Stable US Consumer
EURUSD surged 1 cent higher yesterday as the USD decline continued, but it seems like the 1.12 level is a bit too much for the Euro buyers.

EURUSD surged 1 cent higher yesterday as the USD decline continued, but it seems like the 1.12 level is a bit too much for the Euro buyers. They pushed above this major level twice in the last couple of hours, but both times sellers jumped in and both H1 candlesticks closed below 1.12, forming two upside-down hammer candlesticks with long upper wicks, which are bearish reversing signals after the strong surge since last Thursday.

The Euro continues to struggle, with limited positive drivers in sight. Monday’s weak PMI numbers highlighted that industrial activity remains deep in recession, and the services sector across the Eurozone appears to be heading in the same direction. Yesterday’s data further painted a bleak picture of the economic environment.
Germany’s ifo Economic Climate Index fell to 85.4, missing the expected 86.1, reflecting weaker business sentiment. Additionally, Belgium’s NBB Business Climate declined to -13.3, and confidence in Germany’s economic outlook worsened, intensifying concerns about the stability of the Eurozone economy.
EUR/USD Chart H1 – Sellers Returning at 1.12

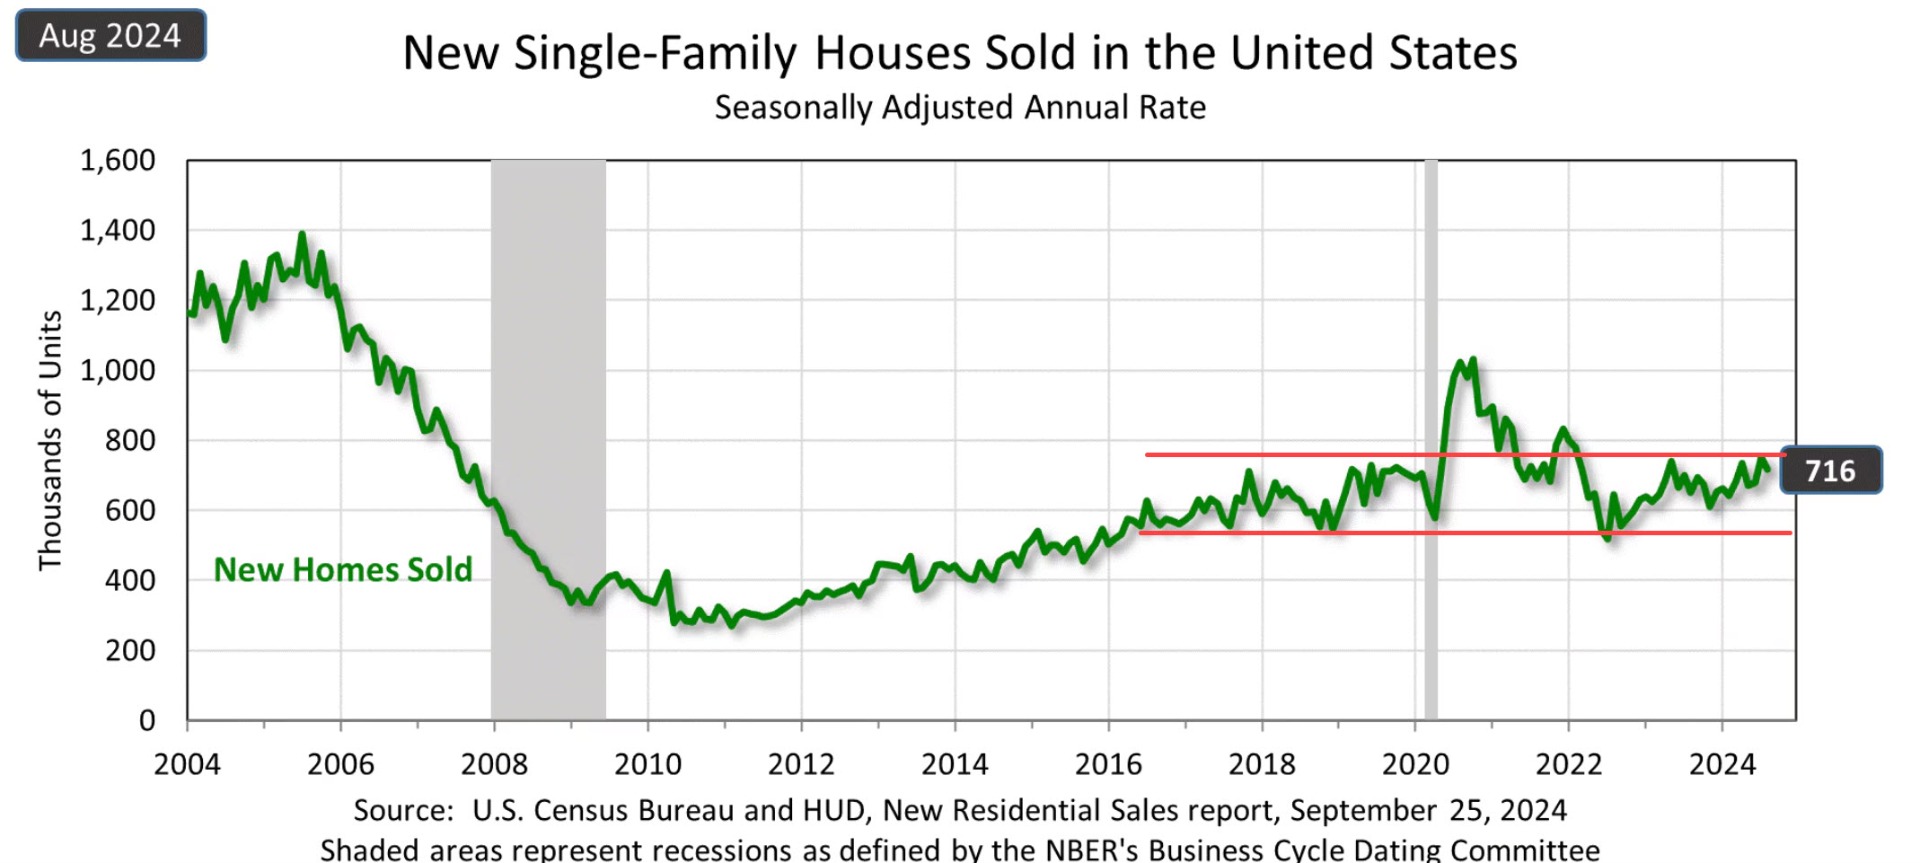
Despite these headwinds, the EUR/USD remains close to the 1.12 level. A break above this point could signal further bullish momentum, with immediate resistance at the July 2023 high of 1.1275, followed by the 1.13 mark. However, the inability of EUR/USD buyers to maintain a position above 1.12 has led to renewed selling pressure as USD buyers step back in. On the other side, the US consumer sector remains resilient. The New Home Sales report showed strength, and as the Federal Reserve begins to lower interest rates, mortgage rates are expected to gradually decline. This will likely provide additional support to the US housing market moving forward.
US New Home Sales (August)
-
- 0.716 million units sold vs. 0.700 million estimated
- Previous month’s figure revised up from 0.739 million to 0.751 million
-
Month-over-Month (MoM) Change in Sales:
- Home sales declined by -4.7% in August
- This is a significant drop from the +10.3% MoM increase in July
-
Home Supply:
- Inventory increased to 7.8 months’ supply, compared to 7.3 months in the prior report
- Rising supply may indicate builders are ramping up construction or sales are cooling off slightly
EUR/USD Live Chart
- Check out our free forex signals
- Follow the top economic events on FX Leaders economic calendar
- Trade better, discover more Forex Trading Strategies
- Open a FREE Trading Account