FTSE Languishes After Worse Than Expected GDP Data
GDP Data ahead of the upcoming national budget showed an increase in activity, although less than analysts’ forecasts.
GDP Data ahead of the upcoming national budget showed an increase in activity, although less than analysts’ forecasts.
Annual GDP Growth published by the Office of National Statistics showed an expansion of 1%, below the forecast of 1.4%. However, the number was slightly higher than last month at 0.9%. Monthly GDP Growth showed an increase of 0.2%, up from last month’s figure of 0.0%.
Numbers give a mixed sentiment; on the one hand they show some expansion, on the other they didn’t meet expectations. The FTSE is down 0.25% at the time of writing, as the market ponders on the Chancellor’s budget.
The Chancellor of the Exchequer will announce the budget on October 30. Various officials have already made hints that the budget will be restrictive in fiscal policy. Stating that the government needs to fill the reported £22 billion black hole.
Analysts expect the budget to include major changes to taxes. The changes would affect income tax, Value-Added tax (sales tax), corporate tax, and National Insurance contributions. The measures are aimed at increasing tax revenue to adjust for higher government spending and reduce national debt.
At the same time, the government has stated it has a priority of increasing business growth. Analysts forecast that the budget would include a variety of measures aimed at supporting small business, including tax breaks.
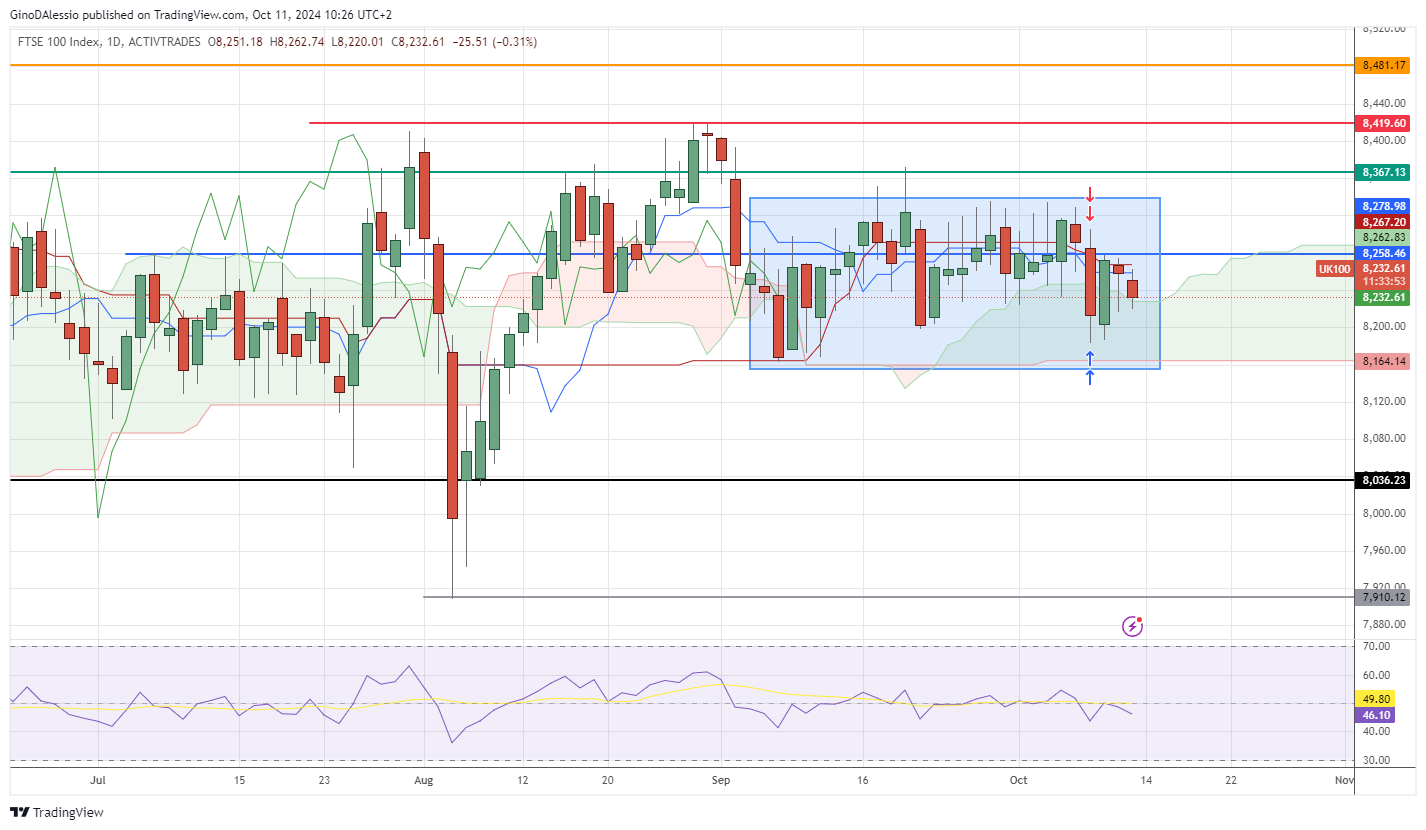
Technical View
The day chart above for the FTSE shows a market in a Sideways trend, with the past 28 candles trading between 8,165 and 8,400 (blue area). The lack of momentum is also indicated by the RSI, which has been hovering between 45 and 55 over this same period.
To understand the possible next direction, we would need to see a break above or below the area of the blue rectangle. Coinciding with the support and resistance of the rectangle, we also have other levels adding to the importance.
The resistance level also coincides with the previous top of 8,367 (green line). While the support level also coincides with the bottom of the Ichimoku cloud at 8,164.
- Check out our free forex signals
- Follow the top economic events on FX Leaders economic calendar
- Trade better, discover more Forex Trading Strategies
- Open a FREE Trading Account
- Read our latest reviews on: Avatrade, Exness, HFM and XM
Related Articles


Sidebar rates
Related Posts
