1.30 Turns Into Resistance for GBP/USD as UK Shop Prices Fall
GBP/USD fell below 1..30 early last week and every attempt to reverse above this level has failed, with the UK economy continuing to weaken.

GBP/USD fell below 1..30 early last week and every attempt to reverse above this level has failed, with the UK economy continuing to weaken. Yesterday the Confederation of British Industry (CBI) Realized Sales report showed that they declined once again this month, after a short-lived jump in September.
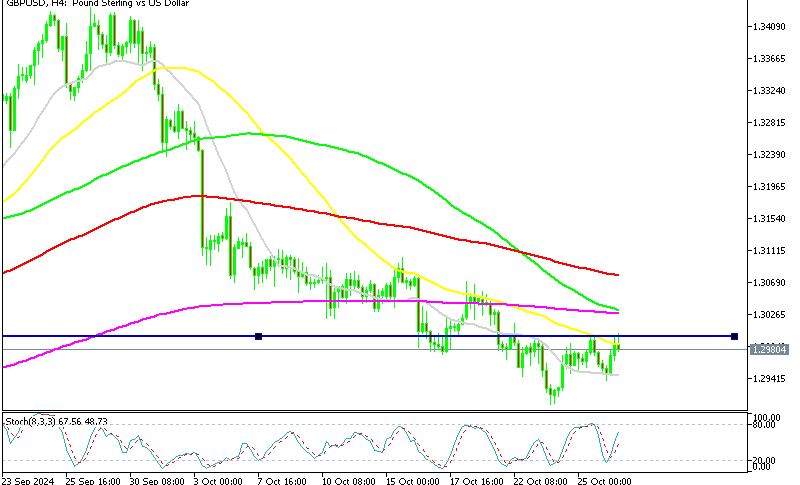
GBP/USD Chart H4 – The 50 SMA Rejected the Price Again
In October, the GBP/USD trend has shifted downward, dropping over 5 cents to reach 1.2907 by Wednesday. This decline underscores the stark difference between the U.K.’s economic fragility and the relative strength of the U.S. economy. The recent UK PMI data shows stagnation in both manufacturing and services, which has further pressured the Bank of England toward a dovish stance. By contrast, October’s U.S. flash PMI reports revealed healthy activity levels in both sectors and pointed to an annualized GDP growth of approximately 2.5%. Additionally, new U.S. orders reached their highest in nearly 18 months, indicating rising demand and further strengthening the dollar against the pound.
Outlook and Key Levels for GBP/USD
Despite a brief GBP/USD recovery from recent lows around 1.29, the pair encountered resistance near the 1.30 mark. By Friday, a bearish reversal sent it down to 1.2960, suggesting that GBP buyers were hesitant to push beyond 1.30. During yesterday’s European session, the pound regained some ground as the U.S. dollar softened, but it again failed to break above 1.3000, where the 50 SMA (yellow) on the H4 chart provided firm resistance.
Though the stochastic indicator has risen in recent days, 1.30 remains a challenging level. Should stochastic indicators become overbought, selling pressure may return, likely resuming the downtrend. Immediate downside targets include the 1.2900-10 zone, with 1.28 as a lower potential target if the bearish momentum persists.
The slowdown in consumer inflation has also picked up pace in the UK in recent months, which is another major negative for the British Pound. Last night we had the UK BRC Shop Price Index which showed another decline in October.
British Retail Consortium (BRC) Shop Price Index for October
- In October, the BRC Shop Price Index declined by 0.8% year-over-year, surpassing the expected drop of -0.5% and following a -0.6% decline in the prior month.
- This marks the eighth time in nine months that the pace of price growth has slowed.
- The British Retail Consortium (BRC) highlighted the following concerns:
- Household relief: The decline in inflation is a positive development for households.
- Risks to continued declines: Downward price movement could face challenges due to:
- Ongoing geopolitical tensions
- Climate change effects on food supply
- Additional costs from planned and upcoming government regulations
GBP/USD Live Chart
- Check out our free forex signals
- Follow the top economic events on FX Leaders economic calendar
- Trade better, discover more Forex Trading Strategies
- Open a FREE Trading Account


