GBP/USD Enters Oversold Zone: Bullish Bounce-Off Expected?
The GBP/USD is trading around $1.2902, attempting a recovery after a steep sell-off earlier this week. The pair recently broke below
The GBP/USD is trading around $1.2902, attempting a recovery after a steep sell-off earlier this week. The pair recently broke below a key ascending channel, highlighting a bearish shift in sentiment.

Immediate support rests at $1.2892, a level aligned with the 23.6% Fibonacci retracement from its previous high, while additional support is seen at $1.2846. A sustained move below these levels would likely open the door for further downside, with next key support at $1.2813.
On the upside, the pair faces immediate resistance at $1.2929, which aligns with the 38.2% Fibonacci retracement level. Breaking above this could allow for a further rise to $1.2957, close to the 50-day EMA, currently positioned at $1.2957, and finally, stronger resistance at $1.2971. These levels are significant, as a sustained move above the 50-day EMA would indicate renewed bullish sentiment, especially if buyers can push GBP/USD above $1.2971.
The Relative Strength Index (RSI) currently sits at 40.06, suggesting mild oversold conditions but not yet signaling a reversal. This reading, combined with the recent downward momentum, implies that a bounce could be short-lived unless the broader trend changes.
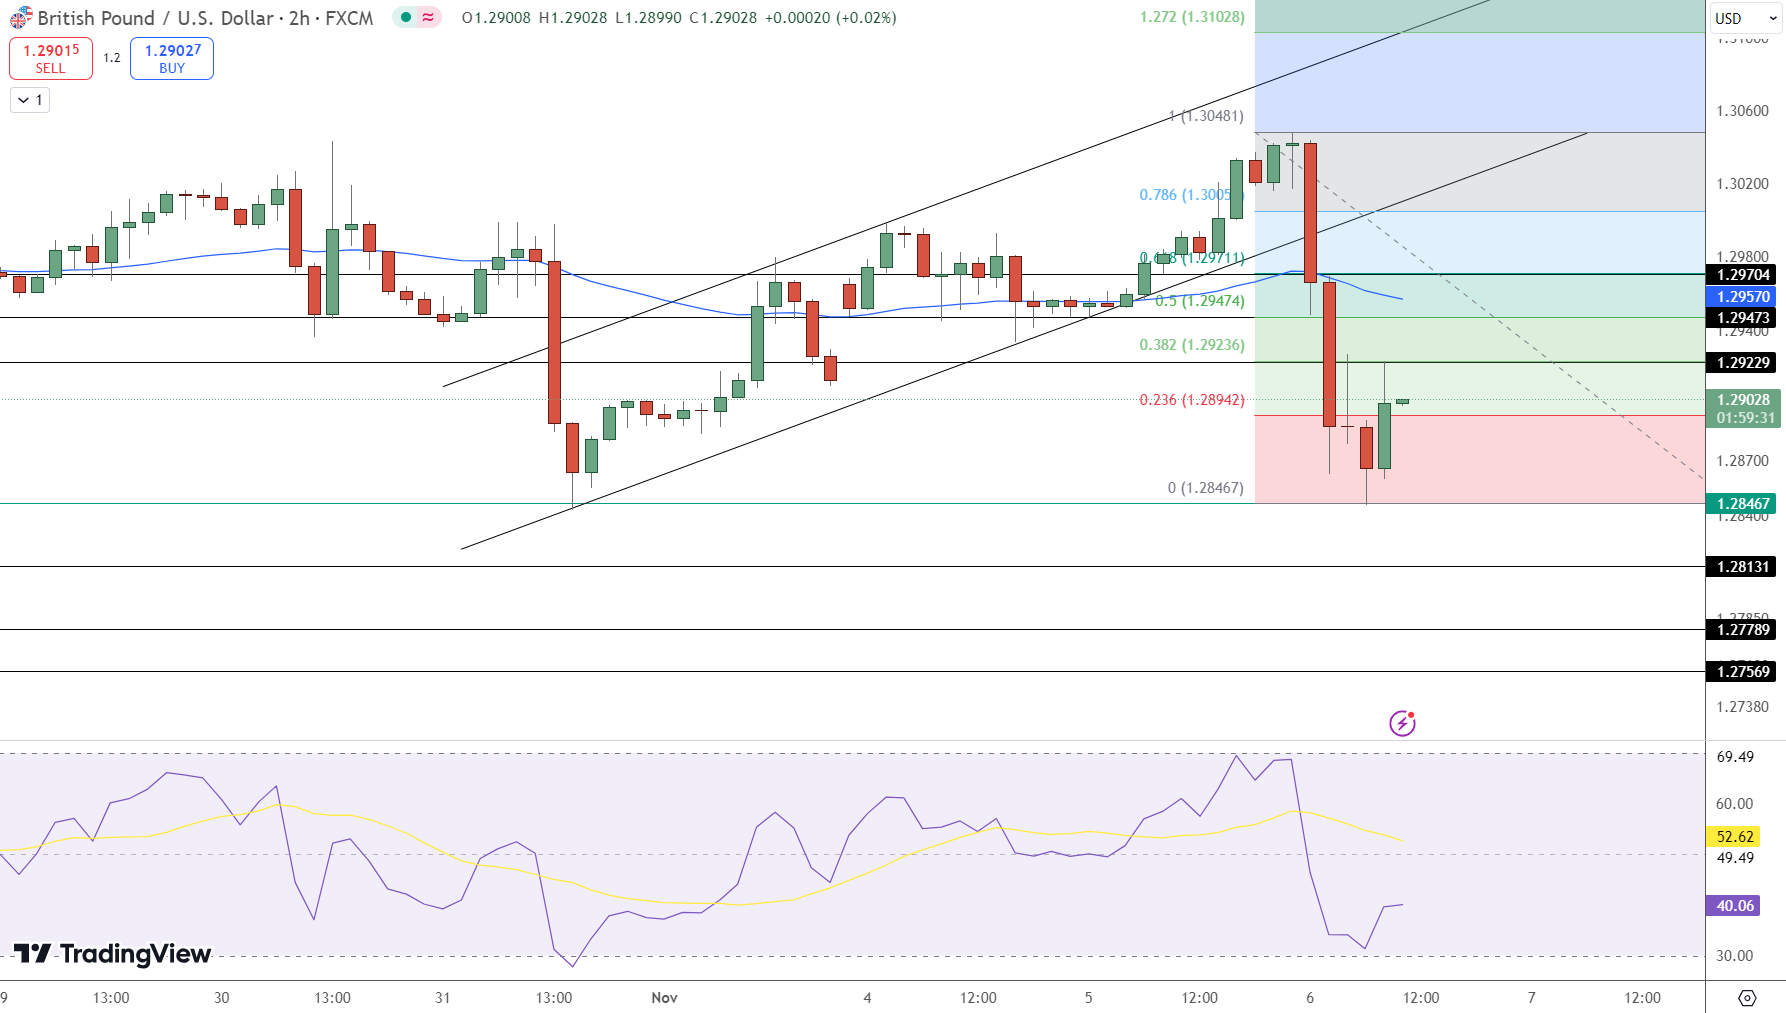
The bearish bias is reinforced by the 50-day EMA ($1.2957) and 200-day EMA ($1.2943), both hovering above the current price, acting as formidable barriers to the upside.
In summary, GBP/USD remains under pressure as long as it trades below $1.2929. Should sellers maintain control, the pair is likely to test the lower support levels in the coming sessions. Conversely, a move above $1.2971 could suggest that buyers are regaining traction, though the upside may be limited without a broader shift in market sentiment.
Key Takeaways:
-
Immediate Support: $1.2892, with next levels at $1.2846 and $1.2813.
-
Resistance Levels: $1.2929 and $1.2971 remain critical for a reversal.
-
RSI: At 40.06, mildly oversold but lacking strong reversal signs.
- Check out our free forex signals
- Follow the top economic events on FX Leaders economic calendar
- Trade better, discover more Forex Trading Strategies
- Open a FREE Trading Account