Can GOAT Break Above Key Resistance at $0.9844? Critical Levels to Watch
Can GOAT break above $0.9844 resistance? Learn about key support levels, RSI trends, and potential rally targets to guide your next move in
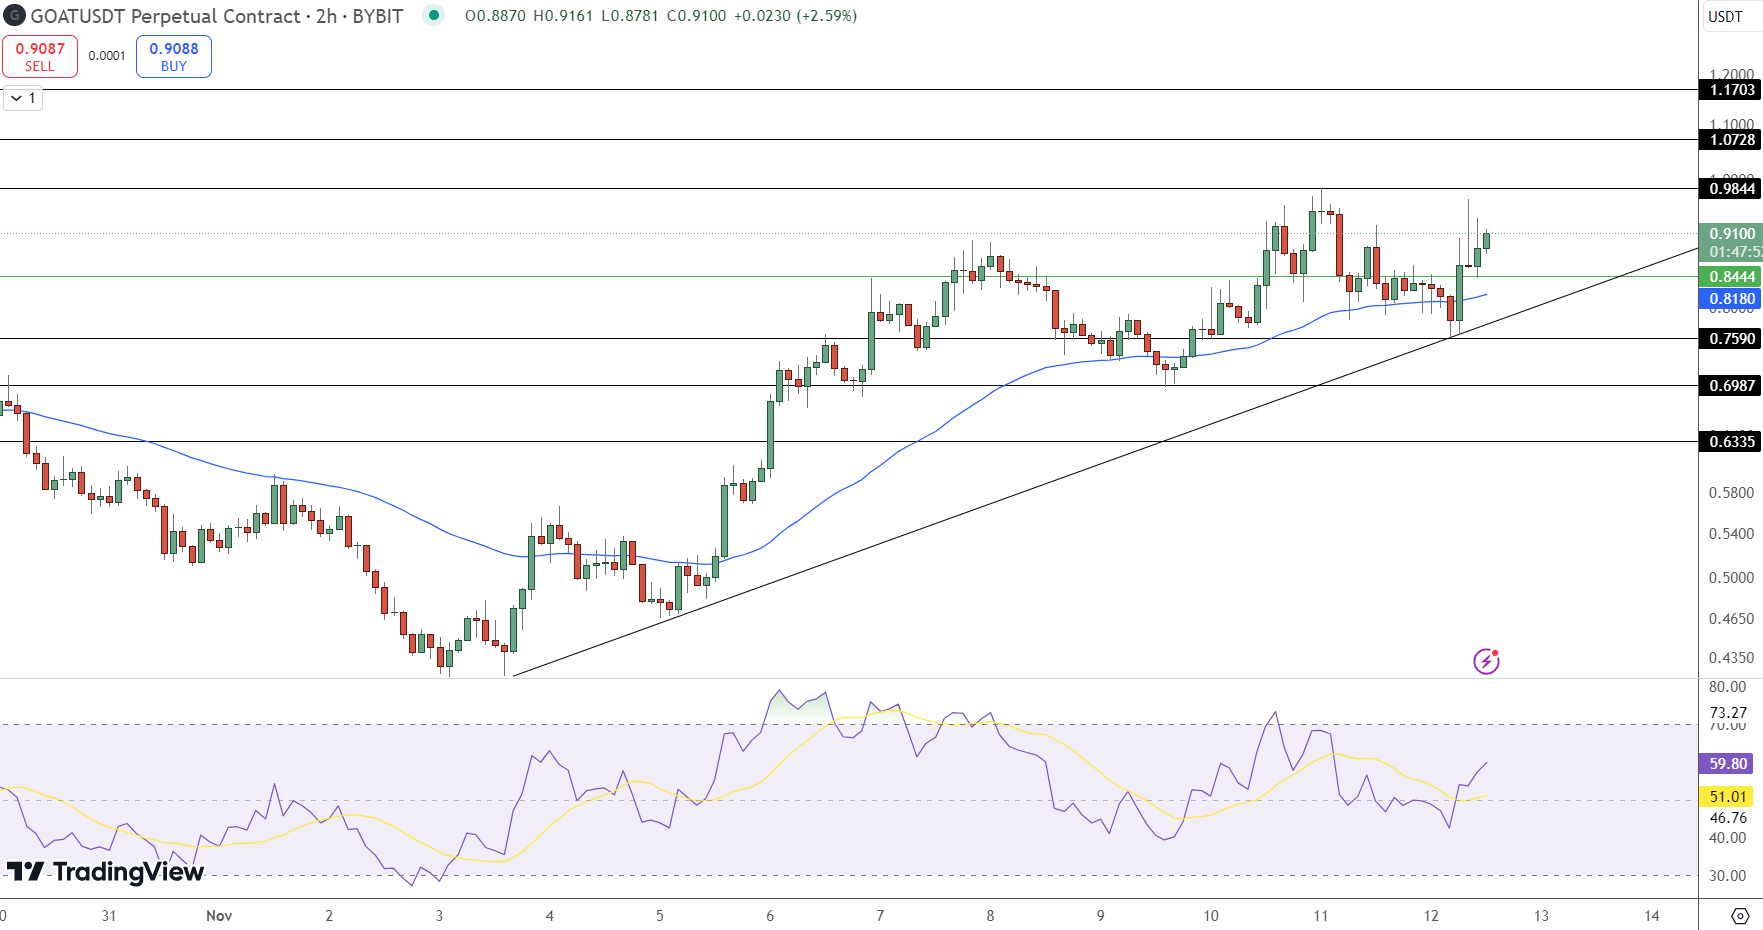
GOAT/USDT has seen steady upward momentum, recently testing a resistance level around $0.9844.

With an ascending trendline providing support and a 50-period moving average as additional support, the asset appears poised for further gains if it can break through the immediate resistance.
Ascending Support and Key Resistance Levels
The price is trading above the ascending trendline, indicating strong upward momentum. The nearest support level lies around $0.8444, aligned with the 50-period moving average, providing a cushion for any short-term pullbacks. However, a sustained break above the $0.9844 resistance could pave the way for an upside target of $1.0728, with the next major resistance level at $1.1703.
Key Levels:
-
Resistance: $0.9844, $1.0728, $1.1703
-
Support: $0.8444 (50-period MA), $0.7590, $0.6987
RSI and Bullish Momentum Indicators
The RSI currently stands at 59.80, reflecting a positive, yet not overbought, sentiment. This level supports further upside potential as there’s room for additional buying momentum before the asset reaches overbought territory. The steady rise in RSI aligns with the trendline and moving average, indicating that bulls maintain control.
Downside Risks Amid Potential Resistance Rejection
If GOAT faces rejection at $0.9844, there’s a potential for a pullback toward $0.8444. Should the price dip below the ascending trendline, additional support may be found at $0.7590 and $0.6987. Monitoring these levels is crucial to gauge if bullish momentum remains intact.
On-Chain Metrics Highlight Potential Market Pressure
While technical indicators remain favorable, on-chain metrics reveal mixed signals. Data from Coinglass shows that open interest in GOAT has declined by 3.87% in the last 24 hours, hinting at an increase in market sell-offs and a slight rise in short positions. The Long/Short ratio currently stands at 0.9448, reflecting a bearish sentiment as short positions outpace longs. Additionally, a notable long liquidation of $2.57 million further signals a potential shift in sentiment.
If these on-chain pressures persist, GOAT may encounter downward pressure, potentially revisiting the support level at $0.7340. Monitoring these metrics will be key to understanding if GOAT can sustain its impressive rally or if bearish forces will gain the upper hand.
This combination of bullish technical indicators and cautious on-chain metrics positions GOAT at a critical juncture, where price movements around key resistance and support levels could define its short-term outlook.
- Check out our free forex signals
- Follow the top economic events on FX Leaders economic calendar
- Trade better, discover more Forex Trading Strategies
- Open a FREE Trading Account