Gold Price Forecast: 8-Week Low Hits $2,557 – Is $2,525 the Next Target?
Gold hits an 8-week low as a stronger U.S. dollar and high Treasury yields pressure prices. Explore key technical levels and market trends d

Gold prices fell for the fifth consecutive session, reaching an eight-week low as a stronger U.S. dollar and rising Treasury yields weighed on the precious metal.

This downtrend aligns with ongoing uncertainty about the Federal Reserve’s approach to interest rate cuts. The U.S. dollar index (DXY) advanced to its highest level in a year, making gold more expensive for international buyers, while Treasury yields surged to levels not seen since July, increasing the opportunity cost of holding non-yielding assets like gold.
My outlook on Gold
We’re seeing a potential retest in the 4H downtrend, with price hovering near a key resistance level. Watching closely for bearish momentum to kick in if price rejects this zone, with a possible target down towards the 2,525 level. #Gold #XAUUSD #forextrading pic.twitter.com/1wCuUE2QhK
— JuniorBoss_Official (@JuniorBoss_Offi) November 13, 2024
Kyle Rodda, a financial market analyst at  The future of trading , observed, “Gold is just being moved by the dollar and yields, creating a mechanical drop in the short term.” Rodda highlighted that recent inflation data might hint at a softer stance from the Fed next month, but the broader outlook for 2024 remains focused on higher inflation expectations and fewer rate cuts.
Market Data and Inflation Concerns Weigh on Gold
U.S. inflation data released Wednesday showed consumer prices rising in line with expectations for October. However, the rate of progress toward lower inflation has decelerated in recent months, raising concerns about the Fed’s future policy actions. Gold, typically seen as an inflation hedge, struggles under higher interest rates, which reduce its appeal by offering no yield.
Despite some Fed officials hinting at potential interest rate cuts, caution persists. St. Louis Fed President Alberto Musalem suggested that inflation may gradually decline, while Dallas Fed President Logan cautioned against aggressive rate cuts that could spur inflation. Traders are now closely monitoring upcoming data, including the U.S. Producer Price Index (PPI) and weekly jobless claims, as well as comments from Fed Chair Jerome Powell scheduled later today.
Key Technical Levels for Gold Spot (XAU/USD)
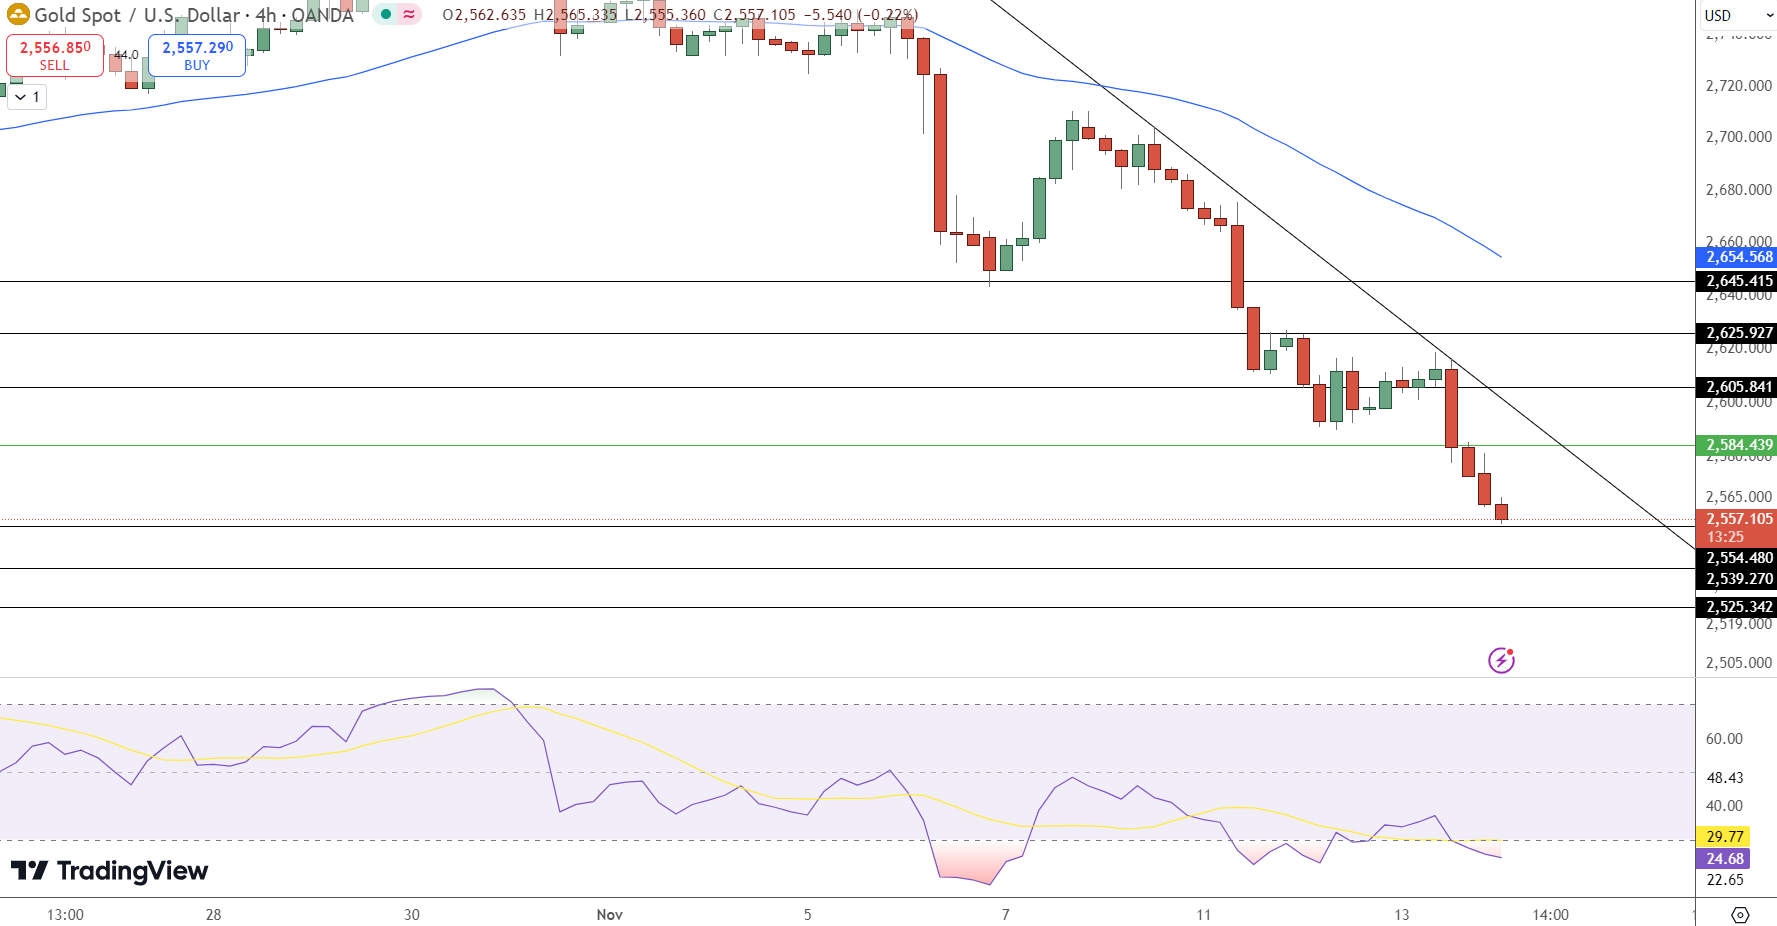
The technical picture for gold continues to reflect a bearish sentiment, driven by a sustained downtrend below its 50-day exponential moving average (EMA). Gold’s current price sits around $2,557, with a recent three black crows candlestick pattern underscoring the selling bias and signaling potential for further downside. The Relative Strength Index (RSI) at 29.77 suggests oversold conditions, potentially indicating a short-term pause or minor retracement.
XAUUSD: bears seem to have broken through a fairly strong support around $2,605 per ounce, which suggests a decline to support around $2,560-2,525. Thus, the metal's immediate prospects have worsened and it is quite obvious that it has entered a correction phase.#TradingIdeas pic.twitter.com/HyKtK2uDUx
— Anton Kharitonov (@Kharitonov_TU) November 12, 2024
-
Key Price Levels:
-
Pivot Point: $2,584.44
-
Immediate Resistance: $2,584.44
-
Next Resistance Levels: $2,605.84, $2,625.93
-
Immediate Support: $2,554.48
-
Next Support Levels: $2,539.27, $2,525.34
-
-
Technical Indicators:
-
RSI: 29.77, nearing oversold
-
50 EMA: $2,654.57, with gold trading well below this level, emphasizing bearish momentum
-
Conclusion: Bearish Outlook Persists for Gold
Gold’s downtrend appears intact, reinforced by both technical indicators and market pressures. The three black crows pattern suggests sustained selling momentum, while a strong dollar and rising yields add to the bearish outlook.
Traders should remain cautious of potential support breaks, as further declines are likely if current conditions persist. However, with the RSI nearing oversold levels, some short-term stabilization may occur before any significant directional move.
Key Insights:
-
Gold trades below the 50-day EMA, signaling continued bearish momentum.
-
A three black crows pattern points to ongoing selling pressure.
-
RSI nearing oversold territory, indicating possible short-term consolidation.
This analysis provides a comprehensive overview for investors monitoring gold’s price movements, emphasizing key levels and indicators to watch amid evolving market dynamics.
- Check out our free forex signals
- Follow the top economic events on FX Leaders economic calendar
- Trade better, discover more Forex Trading Strategies
- Open a FREE Trading Account
- Read our latest reviews on: Avatrade, Exness, HFM and XM
Related Articles
Sidebar rates
