Forex Signals Brief November 25: Inflation and RBNZ Highlight the Week
This week we have inflation reports from the US and Eurozone, as well as the USD Q3 GDP, while the RBNZ is expected to cut rates by 50 bps.

This week we have inflation reports from the US and the Eurozone, as well as the USD Q3 GDP, while the RBNZ is expected to cut rates by 50 bps.
Last week was light until Friday, with several CPI inflation reports from Canada, the UK and the Eurozone showing an increase in prices during October, however that didn’t stop the Euro and the GBP from remaining bearish against the USD, which continued the Trump trade higher. Cryptocurrencies also continued to push higher, with Bitcoin getting within reach of the 100K target, while Gold bounced more than $150 after the deep retreat of the previous weeks.
Although, the USD was further helped by the Services and Manufacturing PMI numbers released on Friday, with the rest of the world showing further global weakness, while the US economy showed further strength. In Germany, France and the UK, besides manufacturing being in deep recession for a long time, the activity the services sector has now also fallen in contraction, which sent EUR/USD and GBP/USD to 2 year lows.
This Week’s Market Expectations
This week we have the Reserve bank of New Zealand which will lower interest rates by 50 basis points, however there are also many inflation reports scheduled for release, such as the Eurozone CPI and the US PCE price index.
Upcoming Economic Economic Events for the Week:
- Monday:
- People’s Bank of China (PBoC) Medium-Term Lending Facility (MLF)
- German IFO Business Climate Index
- Tuesday:
- US Consumer Confidence Index
- Release of FOMC Minutes
- Wednesday:
- Australia Monthly CPI
- Reserve Bank of New Zealand (RBNZ) Policy Decision
- US Q3 GDP (Second Estimate)
- US Personal Consumption Expenditures (PCE)
- US Durable Goods Orders
- US Weekly Jobless Claims
- Thursday:
- German CPI (US markets closed for a holiday)
- Friday:
- Tokyo CPI
- Japan Unemployment Rate
- France CPI
- Switzerland Q3 GDP
- Eurozone CPI
- Canada GDP
Last week the volatility was high and there were quite a few market reversals, with the USD retreating lower during the first half, then turning bullish toward the end of the week. We opened 31 trading signals in total, closing the week with 20 winning forex signals and 10 losing ones.
Gold Bounces Off the 100 Daily SMA
Gold experienced a sharp drop earlier this month, sending XAU/USD to $2,536.77. However, the decline found support at the 20-week SMA (simple moving average), which helped halt the losses. This week’s price action formed a bullish engulfing candlestick on the weekly chart, signaling potential for further upside momentum. The metal rebounded strongly, gaining over $150 in a single week—its most significant weekly increase in several years.
XAU/USD – Daily Chart
NZD/USD Breaks Below the Support at 0.8550
For most of 2024, the NZD/USD exchange rate remained confined within a five-cent range, fluctuating between 0.8550 and the 0.6370s. However, the pair has faced mounting pressure in recent months due to diverging economic conditions between the US and New Zealand. New Zealand’s rising unemployment and declining inflation expectations have reinforced the Reserve Bank of New Zealand’s (RBNZ) dovish stance, paving the way for further NZD depreciation. The RBNZ is widely expected to announce a 50-basis-point rate cut during its upcoming meeting on Wednesday. This forecast follows a substantial drop in the pair, which reached a 2024 low of 0.5850.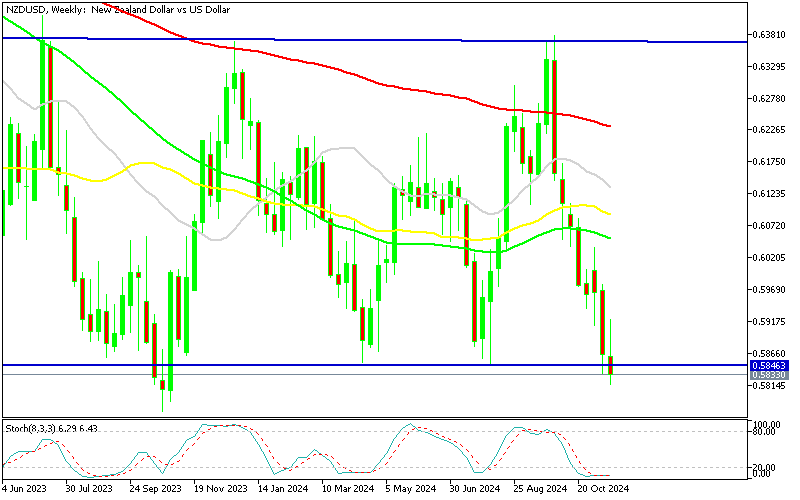
NZD/USD – Weekly Chart
Cryptocurrency Update
Bitcoin Within Touch of 100K

BTC/USD – Daily chart
Ethereum Bounces Off the $3,000 Level
Ethereum mirrored Bitcoin’s movement, dipping below $2,500 before rebounding to $3,450. The recovery also pushed Bitcoin above its 50-day SMA, a critical technical level. Both cryptocurrencies’ recent performance highlights a renewed sense of confidence among investors, suggesting a bullish outlook for the digital asset market, despite ongoing vulnerability to market swings.
ETH/USD – Daily chart
- Check out our free forex signals
- Follow the top economic events on FX Leaders economic calendar
- Trade better, discover more Forex Trading Strategies
- Open a FREE Trading Account
- Read our latest reviews on: Avatrade, Exness, HFM and XM
Related Articles


Sidebar rates
Related Posts
