Gold Price Analysis: $2,639 Near Key Resistance Amid Fed Rate Speculation
Gold is trading at $2,639.98 today as we wait for US inflation numbers to give us a clue on what the Fed will do next.

Gold is trading at $2,639.98 today as we wait for US inflation numbers to give us a clue on what the Fed will do next.

Spot gold is stuck in a $9 range in early trading as investors are cautious ahead of core PCE, jobless claims and GDP revision later today. Market is mixed with CME Group’s FedWatch tool showing 63% chance of a 25bps rate cut in December.
Geopolitical also played a role in gold’s move. The US brokered ceasefire between Israel and Hezbollah reduced safe-haven demand and contributed to the selling earlier this week. But economic uncertainty and potential dedollarization trend will still support gold as a long term hedge against volatility.
Key Technical Levels to Watch
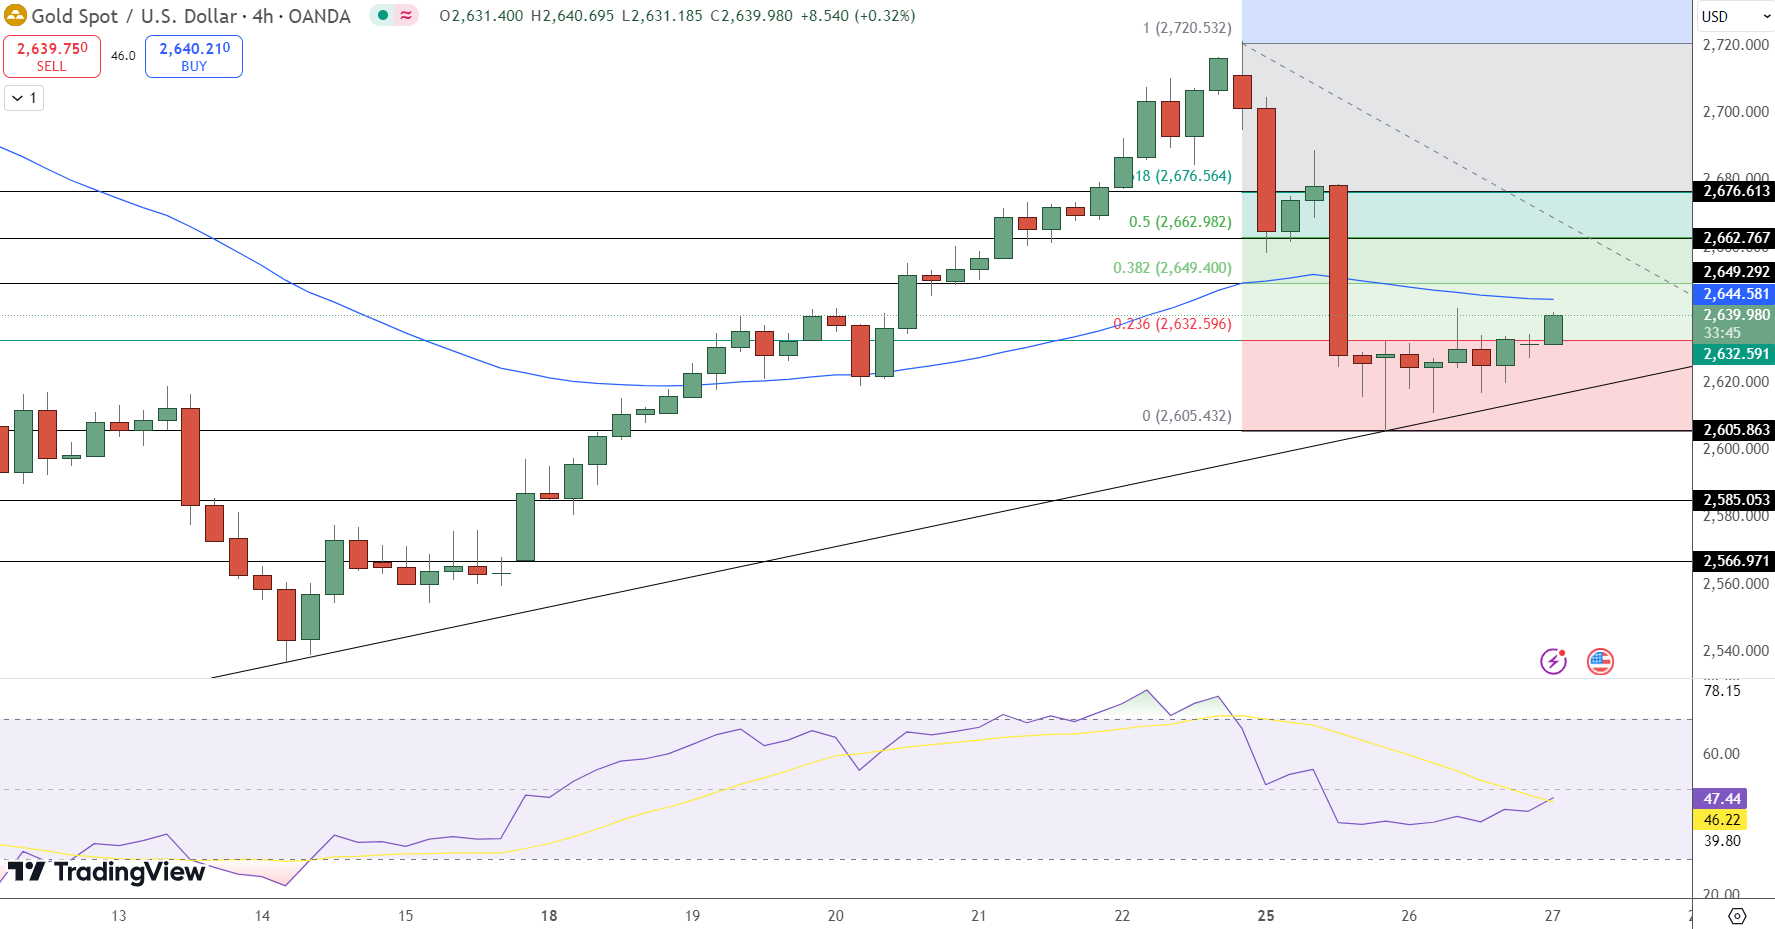
Gold’s technical setup reveals critical levels influencing its next moves. Currently, the pivot point at $2,644.58 represents a key resistance level. Immediate upside targets are at $2,649.29 and $2,662.98, followed by $2,676.56.
On the downside, support is seen at $2,632.59, with further levels at $2,620 and $2,605.43.

GOLD Price Chart – Source: Tradingview
The RSI stands at 46.22, reflecting neutral momentum, while the 50 EMA at $2,644.58 adds significant overhead resistance.
A breakout above the pivot could signal renewed bullish momentum, potentially targeting $2,662.98. Conversely, failure to hold above $2,632.59 may lead to further downside toward $2,620 or below.
Global Dynamics and Market Outlook
Global gold demand was weak in October as China’s net imports via Hong Kong fell 43% year on year. US economic data released yesterday showed the economy is still strong but Fed officials are sending mixed signals on rate cuts.
Traders are waiting for inflation numbers to get a clue on Fed’s direction. With markets pricing in easing, gold is at the crossroads of monetary policy expectations and geopolitical uncertainty.
Gold may consolidate in the short term but long term depends on economic conditions and investor sentiment.
Key Points at a Glance
-
Immediate resistance: $2,644.58; upside targets: $2,662.98, $2,676.56.
-
Immediate support: $2,632.59; next levels: $2,620, $2,605.43.
-
RSI at 46.22: Neutral momentum amid market indecision.
- Check out our free forex signals
- Follow the top economic events on FX Leaders economic calendar
- Trade better, discover more Forex Trading Strategies
- Open a FREE Trading Account


