WTI Crude Oil Drops Below $68.50 Amid Rising U.S. Gasoline Stockpiles
WTI Crude Oil fell on Thursday to $68.43 as a surprise increase in US gasoline inventories trumped all else.

WTI Crude Oil fell on Thursday to $68.43 as a surprise increase in US gasoline inventories trumped all else.

The US Energy Information Administration (EIA) reported a 3.3 million barrel build in gasoline stocks for the week ending November 22, versus expectations of a small draw. This is weaker demand ahead of what was supposed to be record holiday travel.
And to add to the bearishness, concerns about Middle East supply disruptions have eased after the Israel/Hezbollah ceasefire. While geopolitical risks are always a wild card, the immediate risk to oil supply from the region has vanished, and that’s weighing on crude.
OPEC+ Meeting Holds Key to Oil’s Direction
Now the oil market looks to Sunday’s OPEC+ meeting where the group will discuss delaying the January 2024 output increase. Market strategists like Suvro Sarkar of DBS Bank think the expectation of a delay is already priced into oil futures, the question is how long the delay will be – one month, three months or more.
OPEC+ which controls almost half of the world’s oil supply has so far managed to keep prices stable through supply cuts. But slowing demand growth in big economies like the US and China is still weighing on crude. If OPEC+ doesn’t announce an extension of the delay, oil prices could fall further.
Technical Outlook: WTI Faces Downward Pressure
WTI remains entrenched in a bearish trend as a descending trendline caps any attempts to move above the $68.98 pivot level. Key resistance is found at $68.98, with additional hurdles at $70.26 and $71.21. On the downside, support lies at $68.02, followed by $67.29 and $66.59, where a potential double-bottom pattern may emerge.
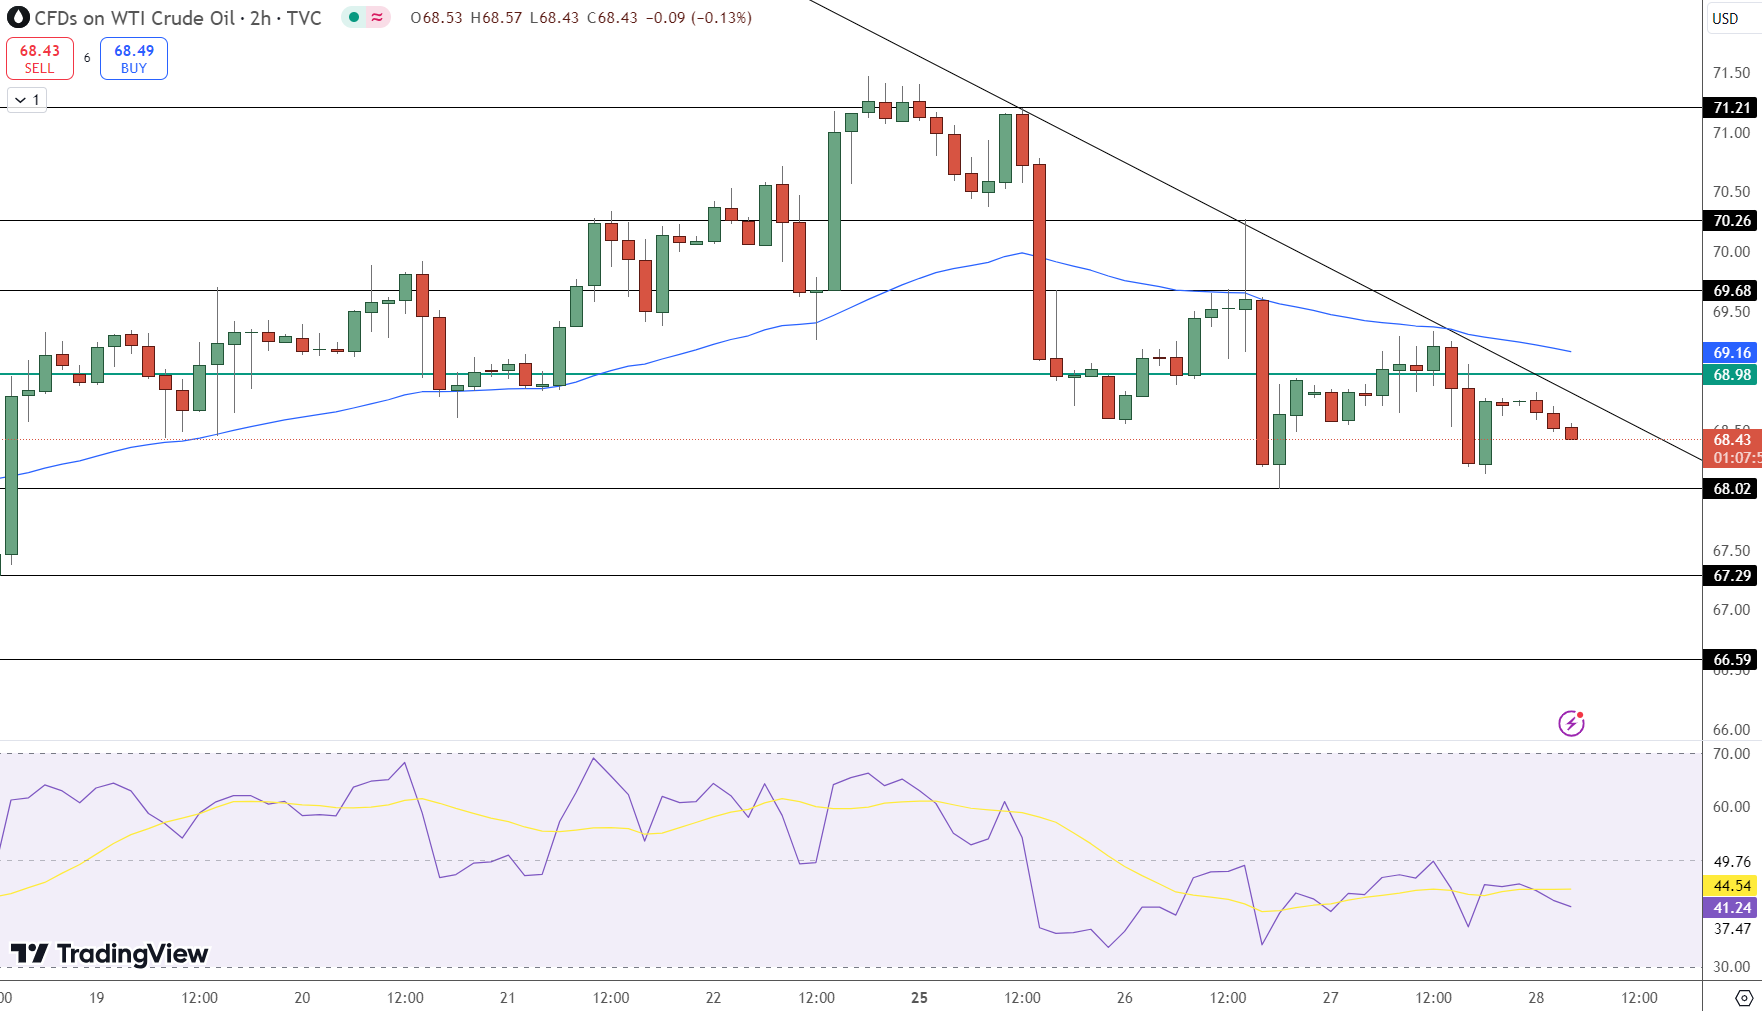
Technical Indicators:
- RSI: Currently at 41.24, signaling mild bearish momentum but no oversold conditions.
- 50-EMA: Positioned at $68.98, acting as a critical barrier to upside recovery.
Key Insights:
- Inventory Surge: U.S. gasoline stocks rose by 3.3 million barrels, adding to bearish momentum.
- Resistance Levels: Immediate resistance at $68.98, with further levels at $70.26 and $71.21.
- Support Levels: Watch $68.02 and $67.29 for potential bearish continuation.
- Check out our free forex signals
- Follow the top economic events on FX Leaders economic calendar
- Trade better, discover more Forex Trading Strategies
- Open a FREE Trading Account
- Read our latest reviews on: Avatrade, Exness, HFM and XM
Related Articles


Sidebar rates
Related Posts
