Gold Prices Dip 3% in November Amid Strong Dollar and Profit-Taking
Gold (XAU/USD) fell to $2,628.33 on Monday, down 0.29% after a four day rally as the US dollar strengthened and people took profits.

Gold (XAU/USD) fell to $2,628.33 on Monday, down 0.29% after a four day rally as the US dollar strengthened and people took profits.

The dollar index rose 0.5% making gold more expensive for others. According to IG market strategist Yeap Jun Rong, “The yellow metal is being taken out as geopolitical risk premiums unwind alongside a stronger US dollar.”
November was tough for gold, down 3% the worst month since September 2023. The decline comes as the markets prepare for potential policy changes from the Fed and new tariff policies from the incoming Trump administration. Higher interest rates which increase the opportunity cost of holding non-yielding assets like gold, also weighed on prices.
Key U.S. Data Could Shape Fed’s Rate Path
Now the focus is on key US data this week including job openings, ADP employment and nonfarm payrolls. Fed Chair Jerome Powell will also speak on Wednesday to give clues on the Fed’s monetary policy.
Currently the CME Group’s FedWatch Tool shows a 65.4% probability of a 25bp rate cut in December. But if the Fed holds rates into 2025 gold could come under further pressure. Higher rates erode gold’s appeal especially during periods of dollar strength.
“It’s all about the Fed’s message” said Rong. “A clearer stance on rate holds could weigh further on the yellow metal.”
Tariffs and Global Politics Add Market Uncertainty
Political events have added another layer of uncertainty. On Saturday Donald Trump demanded that BRICS countries not support a new currency to rival the US dollar or else he will impose 100% tariffs. Geopolitical risk usually lifts gold but recent dollar strength has been more important and has kept gold under pressure.
Gold Technical Outlook: Bearish Momentum Persists
Gold broke below a critical upward trendline at $2,645.21, now acting as a pivot resistance. Immediate resistance levels are seen at $2,657.00 and $2,678.49, with further hurdles at $2,704.20. On the downside, support rests at $2,626.97, followed by $2,605.86 and $2,581.45.
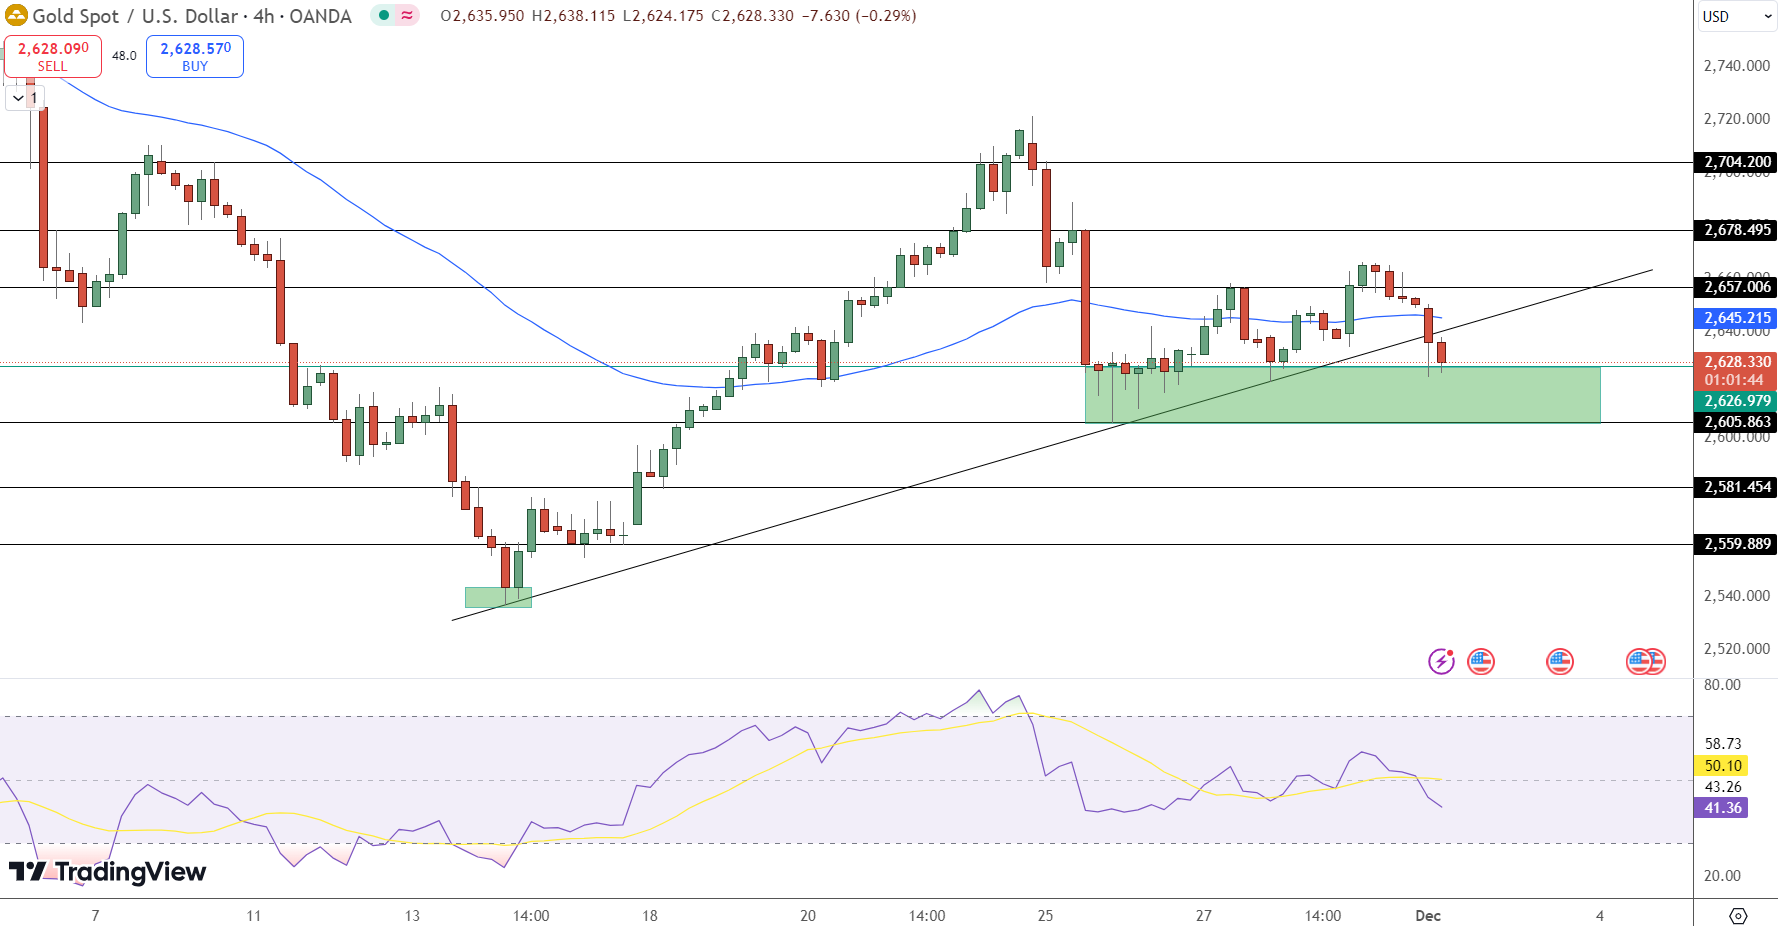
- RSI: At 41.36, reflecting bearish momentum with room for further declines.
- 50-EMA: Positioned at $2,645, reinforcing resistance and signaling caution.
- Outlook: A sustained move below $2,626.97 could trigger a deeper correction, while a decisive rebound above $2,645 may negate the downtrend.
Gold traders should monitor key U.S. data and Fed commentary closely, as both could set the tone for December’s market trajectory.
- Check out our free forex signals
- Follow the top economic events on FX Leaders economic calendar
- Trade better, discover more Forex Trading Strategies
- Open a FREE Trading Account
- Read our latest reviews on: Avatrade, Exness, HFM and XM
Related Articles


Sidebar rates
Related Posts
