Silver Prices at $30.55: 3 Key Factors Driving the Bearish Trend
Silver (XAG/USD) remains under pressure, trading at $30.55 after hitting an intra-day low of $30.05. The primary driver behind...
Silver (XAG/USD) remains under pressure, trading at $30.55 after hitting an intra-day low of $30.05.
The primary driver behind this bearish move is the renewed strength of the US Dollar (USD), fueled by expectations of slower Federal Reserve rate cuts and rising US Treasury yields.
The USD has gained additional support amid escalating geopolitical uncertainties. The ongoing US-China trade war, marked by tariffs and diplomatic tensions, has increased demand for the greenback as a safe haven.
President-elect Donald Trump’s tough stance on global trade, including threats of punitive tariffs and taxes on countries reducing USD dependency, has added to silver’s downward momentum.
Moreover, geopolitical risks such as the Russia-Ukraine conflict have paradoxically strengthened the USD, overshadowing silver’s appeal as a hedge against instability. As a result, silver’s struggle to attract investor interest continues despite ongoing global tensions.
China’s Economic Data Fails to Boost Silver
Recent economic data from China offered mixed signals for market participants. The official Manufacturing PMI rose slightly to 50.3 in November, indicating modest expansion in the manufacturing sector. However, the Non-Manufacturing PMI eased to 50.0, pointing to slower growth in services.
While the private-sector Caixin Manufacturing PMI showed a significant increase to 51.5, hopes for additional stimulus measures from the Chinese government have failed to counterbalance silver’s bearish trend. Investors are optimistic that domestic economic support could stimulate demand, but silver prices remain weighed down by USD strength.
[[XAG/USD-graph]]
Technical Outlook: Downward Channel Dominates
Silver continues to trade within a well-defined downward channel, reflecting bearish sentiment on the 4-hour timeframe. The 50-EMA ($30.56) acts as dynamic resistance, capping upward momentum. Immediate resistance levels lie at $30.91, $31.33, and $31.85, while support levels are seen at $30.03, $29.65, and $29.16.
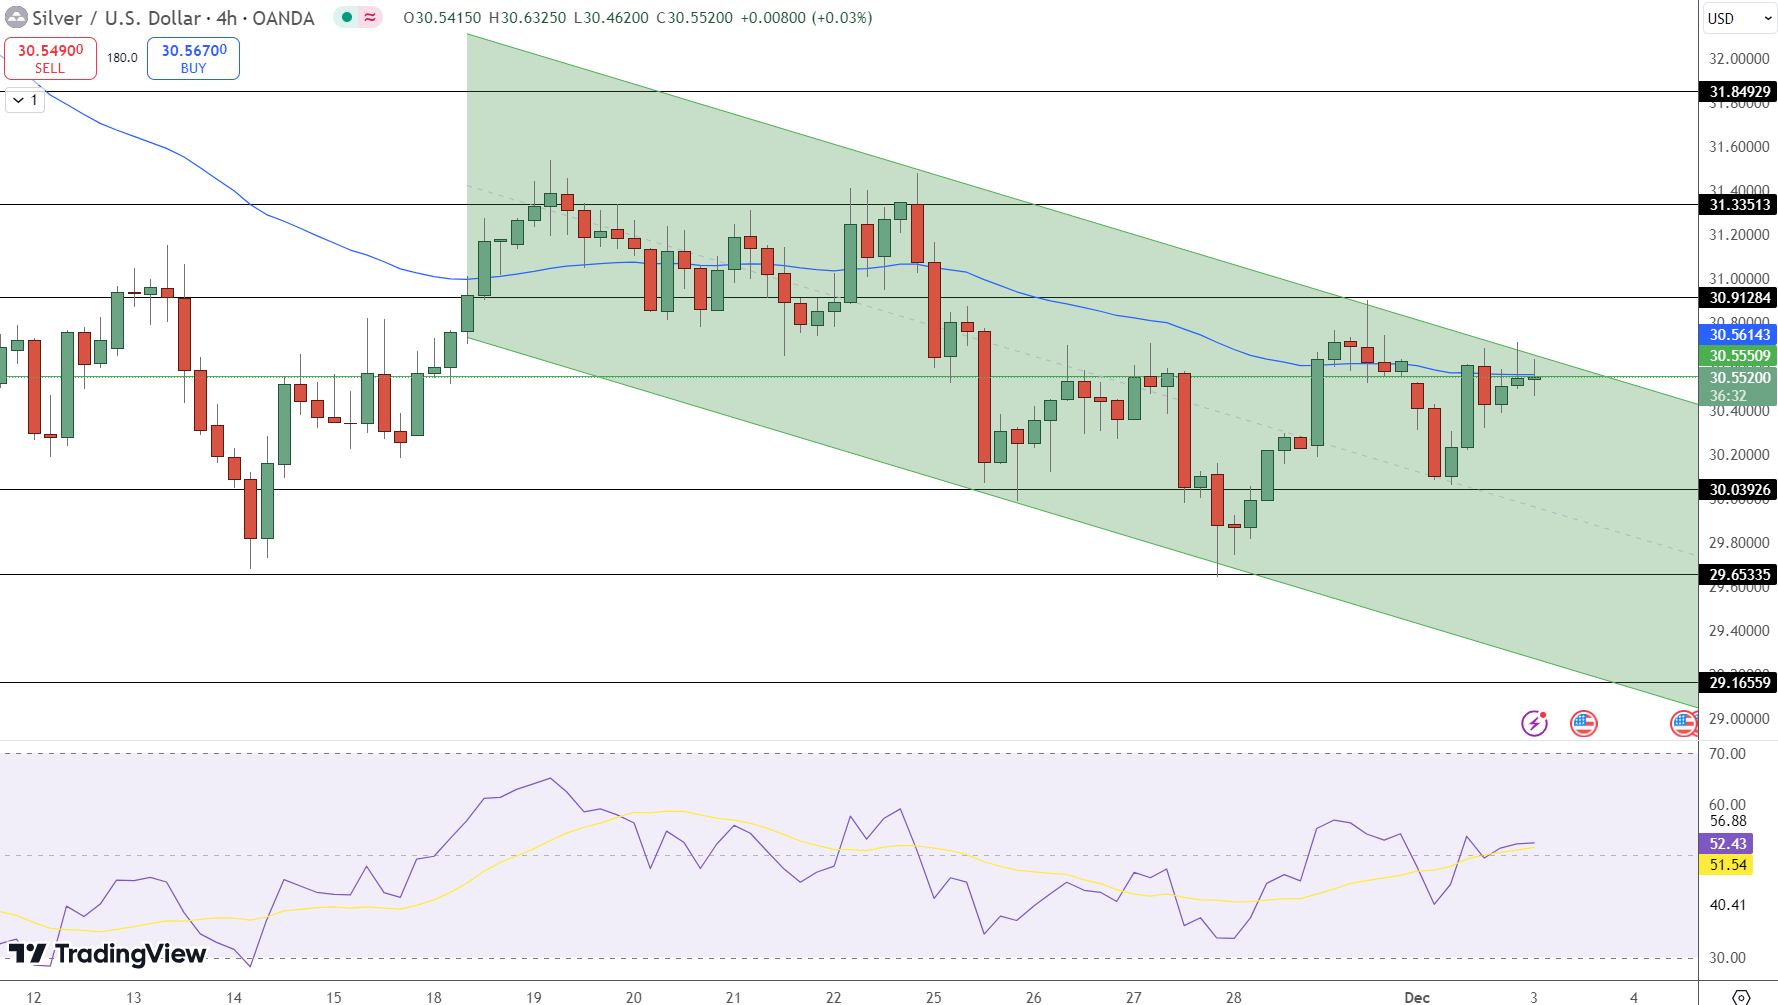
The RSI at 52.4 signals neutral momentum, but the channel structure favors further downside. A break above $30.91 could signal a reversal, while a drop below $30.03 would open the door to further declines. Traders should monitor interactions with the channel’s boundaries for breakout signals.
Key Takeaways:
-
Silver trades at $30.55 within a bearish channel, pressured by USD strength.
-
Resistance levels: $30.91, $31.33, and $31.85; Support levels: $30.03, $29.65, and $29.16.
-
Upcoming US economic data, including the Nonfarm Payrolls, could influence silver’s trajectory.
- Check out our free forex signals
- Follow the top economic events on FX Leaders economic calendar
- Trade better, discover more Forex Trading Strategies
- Open a FREE Trading Account
- Read our latest reviews on: Avatrade, Exness, HFM and XM
Related Articles

Sidebar rates
Related Posts
