Nasdaq, S&P 500 and Bitcoin Close the Day Down After FOMC Cut
Stock markets plunged lower today, with the S&P and Nasdaq losing more than 3% while Bitcoin dived nearly 5%, heading toward 100K again.
Stock markets plunged lower today, with the S&P and Nasdaq losing more than 3% while Bitcoin dived nearly 5%, heading toward 100K again.
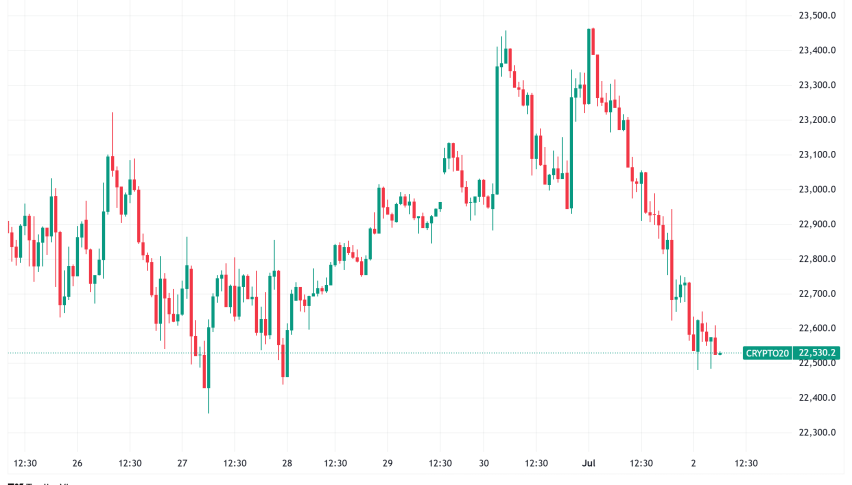
Bitcoin also mirrored the market’s volatility. After reaching $108.3K yesterday, the cryptocurrency reversed sharply, shedding $4,800 today—a drop of nearly 5%—and is now down for the week. These developments may point to growing concerns of excessive speculation in both equities and cryptocurrencies.
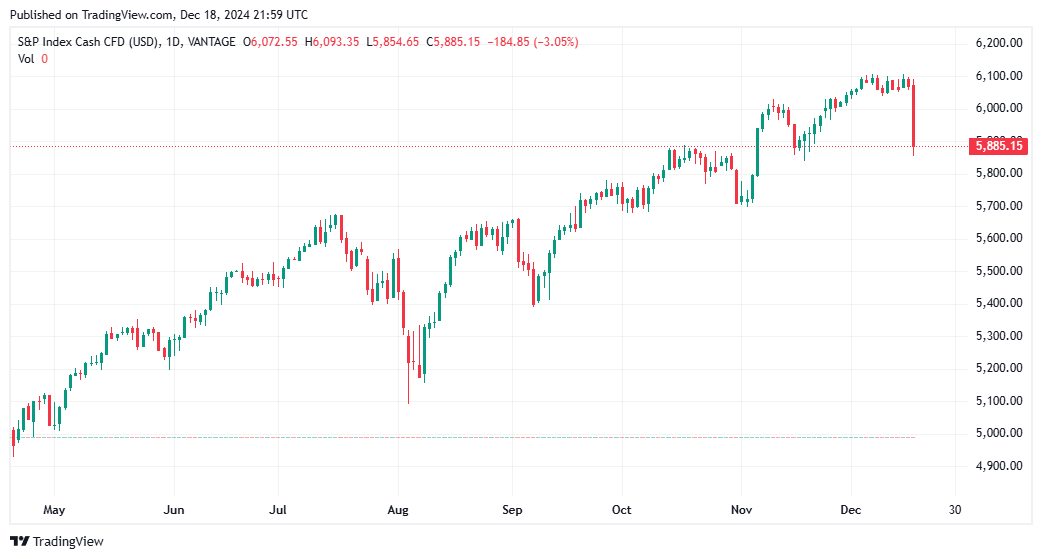
Federal Reserve’s signal of reduced monetary easing in 2025 triggered a sharp sell-off across major U.S. stock indices. The projected Fed funds target rate now stands at 3.9%, up from 3.5% following the September meeting. The Dow Jones Industrial Average declined for the tenth consecutive trading day, marking its steepest single-day drop since August 5, when the index fell by 3%. Today’s decline slightly exceeded that figure. Similarly, the S&P 500 experienced its worst session since August 5, when it dropped 2.8%. The Nasdaq Composite, meanwhile, fell 3.5%—its sharpest loss since July 24.
S&P Chart Daily – Falling Below $5,900
Among individual stocks, Micron Technology reported Q1 earnings of $1.79 per share, in line with analysts’ estimates of $1.77. Revenue also matched forecasts at $8.7 billion. However, shares tumbled 16.8% in after-hours trading after a 4.33% decline during the day. The sell-off was driven by disappointing Q2 guidance, with expected revenues of $7.7–$8.1 billion, falling short of the consensus estimate of $8.99 billion. Adjusted earnings-per-share projections ranged from $1.33 to $1.53, also below the anticipated $1.92.
Tesla, which had surged 70% since election night, has been a standout performer in the post-election equity rally. However, today signaled a potential shift in sentiment. Tesla shares hit an intraday high of $488.54 early in the session but reversed sharply, closing down approximately 11%. This performance made Tesla the Nasdaq’s worst-performing large-cap stock for the day. If the stock closes at its current level, the chart would display a three-candle reversal pattern, a possible indicator of a broader market correction.
Bitcoin Live Chart
- Check out our free forex signals
- Follow the top economic events on FX Leaders economic calendar
- Trade better, discover more Forex Trading Strategies
- Open a FREE Trading Account