NIKKEI225: Honda & Nissan in Merger Talks – Index Remains Range Bound
The Nikkei newspaper reported that Honda and Nissan are undergoing talks of collaboration under a holding company.
The Nikkei newspaper reported that Honda and Nissan are undergoing talks of collaboration under a holding company.
- Honda and Nissan explore MOU agreement
- Export tariffs and rate hikes weigh
- NIKKEI225 stuck in wide range
The NIKKEI225 is flat on the day despite a surge in Nissan stock price, which opened today 23% higher than yesterday’s close. Honda shares are down 3% on the day.
Honda and Nissan Reported to Be in Merger Talks
The Nikkei newspaper reported unidentified sources saying that the two automakers are in talks to set up a holding company. The two Japanese companies would collaborate, making use of shared sources under a memorandum of understanding (MOU).
The move would allow the two automakers to share resources and technology in an ever-increasing competitive market.
On Tuesday, both Honda and Nissan issued identical statements that they were not undertaking merger talks.
The MOU, although not an automatic path to a merger, can also include details for such. This type of agreement is also not legally binding in what concerns the elements of collaboration.
NIKKEI225 Like Chart
Tariffs and Rate Hikes
The specter of higher interest rates and a tariff war still weigh on the NIKKEI225 index. The US is one of Japan’s top trading partners. In September this year the US accounted for Japan’s largest exports, with ¥1.85 trillion in goods.
The consequences of trade tariffs would clearly impact Japan’s economy and automakers in particular.
The BoJ’ monetary policy stance is also still a concern. The market is aware that hikes are coming, but there is lack of a clear path. Uncertainty is probably worse than having the knowledge.
Policymakers are trying to juggle defending against inflation and protect the stock market from volatile swings. However, stock investors are also weary of paying premiums for stocks given the unclear path forward.
NIKKEI225 Daily Chart
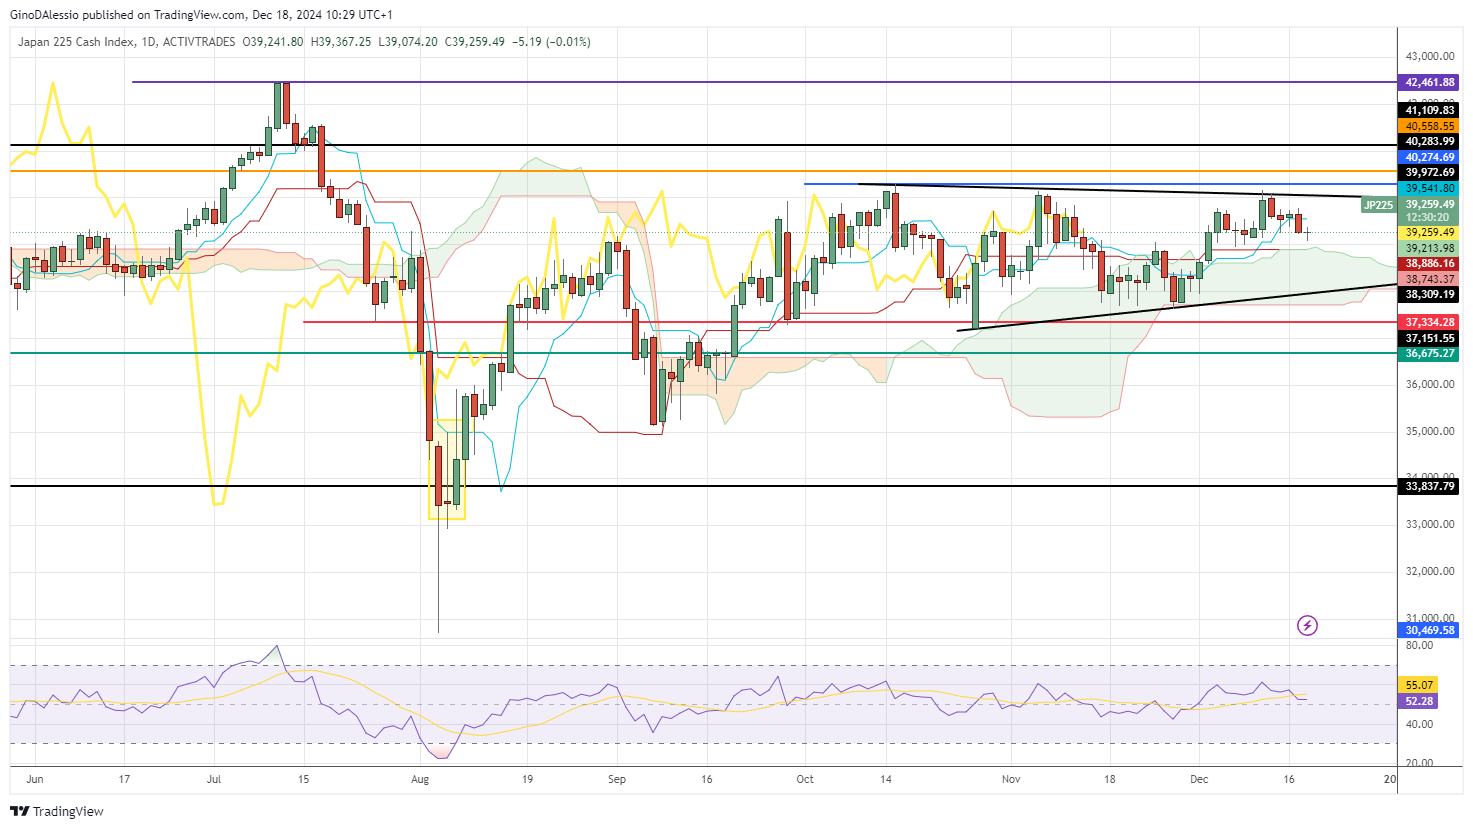
Technical View
The daily chart above for the NIKKEI225 shows a wide sideways trend that started in August. The market is technically in a bullish trend, with prices above the Ichimoku cloud.
However, there is a clear lack of direction and momentum. The lack of direction can be seen by the lower highs and higher lowers since October. With the candles encapsulated by the two diagonal black lines.
The lack of momentum is clear over the same time, as the RSI has not managed to print above 60 or below 40.
We will need a clear breakout of this triangular pattern to have an indication of the next move.
- Check out our free forex signals
- Follow the top economic events on FX Leaders economic calendar
- Trade better, discover more Forex Trading Strategies
- Open a FREE Trading Account
- Read our latest reviews on: Avatrade, Exness, HFM and XM
Related Articles


Sidebar rates
Related Posts
