Gold Prices Analysis: Will $2,595 Support Hold Amid Geopolitical and Market Pressures?
Gold (XAU/USD) rebounded strongly during Thursday’s European session, trading around $2,622 after hitting a one-month low earlier...

Gold (XAU/USD) rebounded strongly during Thursday’s European session, trading around $2,622 after hitting a one-month low earlier in the week.

Investors are flocking to gold as geopolitical risks and fears of a global economic slowdown reignite demand for safe-haven assets. Meanwhile, growing trade war concerns and U.S.-China tensions further bolster gold’s appeal amid a volatile market environment.
The metal’s recovery coincides with a steady U.S. Dollar, which continues to benefit from the Federal Reserve’s cautious monetary policy. The Fed delivered a widely expected 25-basis-point rate cut this week, bringing rates to 4.25%-4.50%, but signaled a slower pace of rate reductions in 2025. This hawkish outlook, reflected in the Fed’s updated dot-plot, raised U.S. Treasury yields and capped gold’s rally.
Fed’s Rate Projections Weigh on Gold
Federal Reserve Chair Jerome Powell underscored the central bank’s measured approach to further rate cuts, emphasizing that inflation remains above the 2% target. The updated projections indicate only two rate cuts in 2025, down from four anticipated earlier, adding upward pressure on the U.S. Dollar.
U.S. economic data offers mixed signals, further influencing market sentiment. Retail sales in November grew by 0.7%, beating expectations, while the S&P Global Composite PMI improved to 56.6. However, manufacturing activity continues to struggle, with the PMI dropping to 48.3, signaling contraction. These economic indicators, combined with the Fed’s hawkish tone, suggest continued challenges for gold as a non-yielding asset.
On the global front, China’s economy faces mounting pressures, with record capital outflows of $45.7 billion in November. Authorities are targeting a 5% growth rate for 2025 but lack substantial fiscal support to stimulate domestic demand. This adds to global uncertainty, further enhancing gold’s status as a hedge against economic instability.
Technical Outlook: Key Levels to Watch
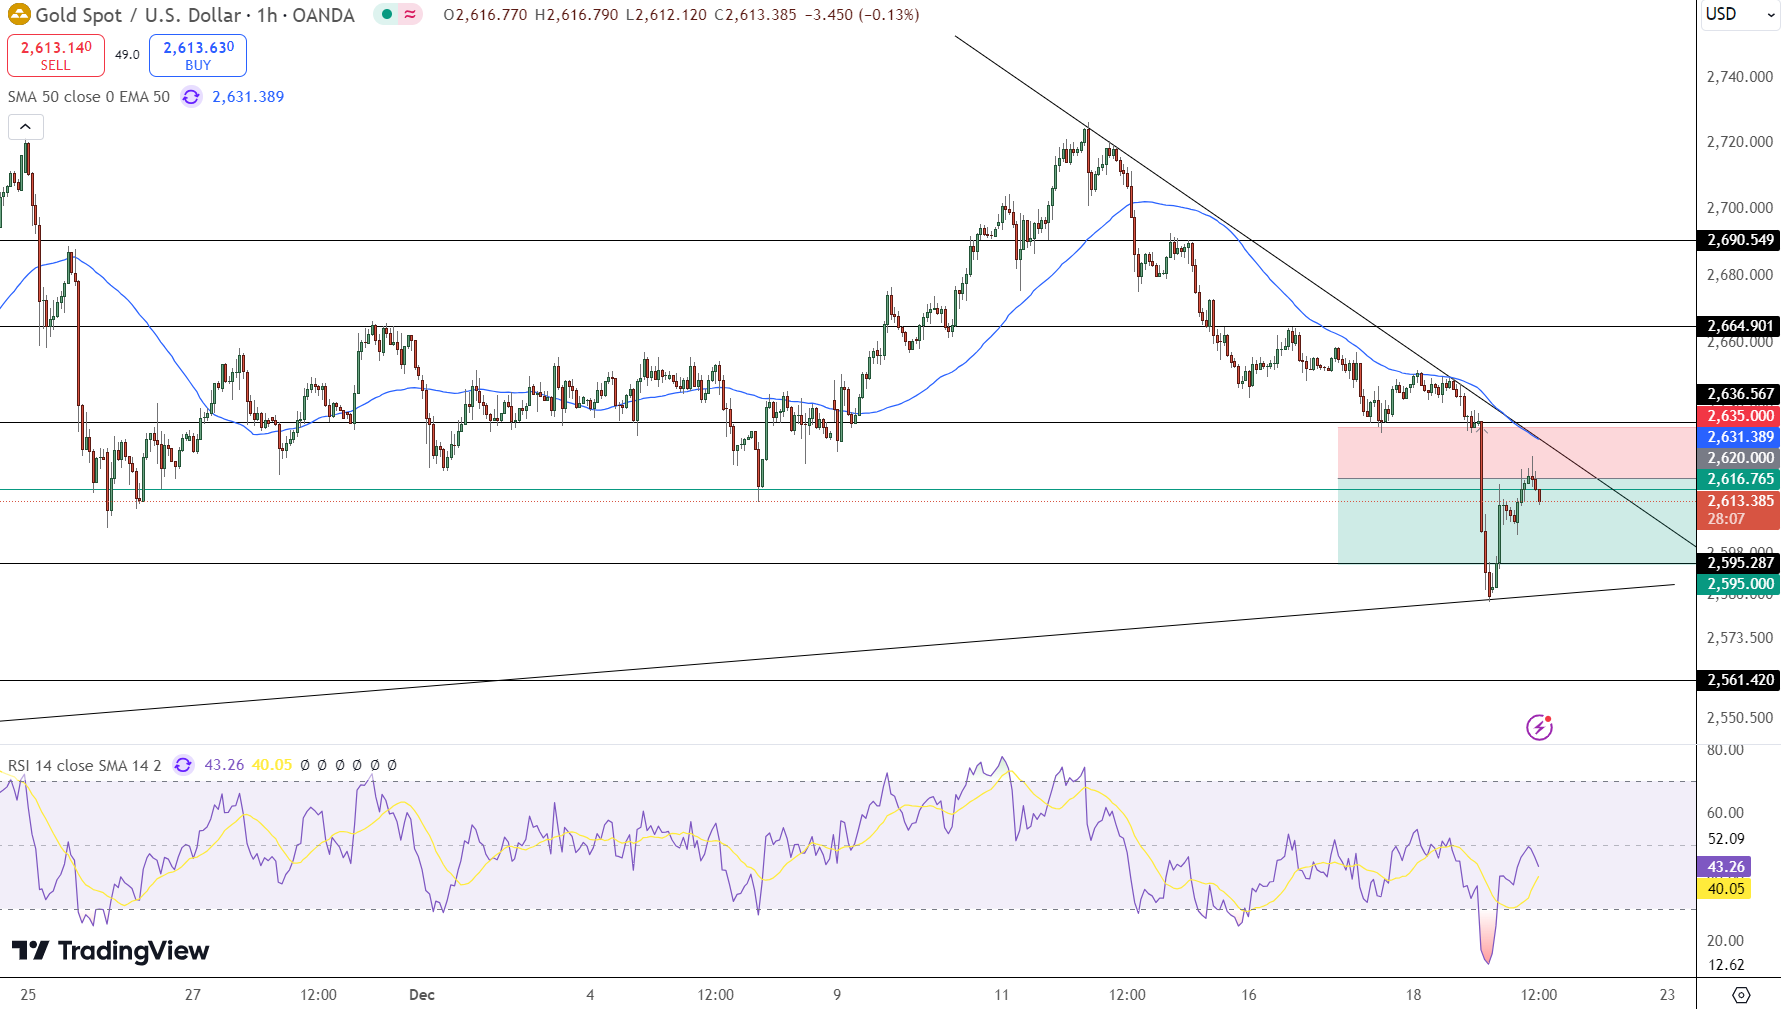
Gold’s technical setup remains bearish as it trades near $2,613, below key resistance at $2,631.38. A descending trendline continues to restrict upside momentum, while the Relative Strength Index (RSI) at 43.15 signals limited recovery potential.
-
Resistance Levels: $2,631, $2,635, $2,664
-
Support Levels: $2,595, $2,561, $2,550
The 50-day EMA at $2,631 aligns with the bearish trend, making this level pivotal for a sentiment shift. A break above $2,631 could signal bullish momentum, while a failure to hold $2,595 risks further declines.
Key Insights:
-
Gold trades near $2,613, facing resistance at $2,631.
-
RSI suggests limited recovery; momentum remains bearish.
-
A break below $2,595 could trigger declines toward $2,561.
- Check out our free forex signals
- Follow the top economic events on FX Leaders economic calendar
- Trade better, discover more Forex Trading Strategies
- Open a FREE Trading Account