USD/JPY Hits 157.55: Fed’s Hawkish Stance and BoJ Policies Drive 5-Month Highs

The USD/JPY pair is trading near multi-month highs, hovering around 157.55 during the European trading session.

This upward momentum stems from the Federal Reserve’s hawkish stance, signaling its commitment to elevated interest rates to curb inflation. The widened US-Japan interest rate differential favors the US Dollar, supported further by robust Treasury yields and resilient US economic indicators.
Meanwhile, the Japanese Yen remains under pressure as the Bank of Japan (BoJ) maintains a cautious approach to monetary tightening. Governor Kazuo Ueda’s emphasis on monitoring wage growth before implementing aggressive rate hikes underscores the BoJ’s reluctance to act swiftly. This dovish stance has deterred investors, further strengthening the USD against the JPY.
BoJ’s Dovish Policies Weigh on Yen
Minutes from the BoJ’s October meeting reveal a measured approach to policy shifts, with potential rate hikes delayed until late fiscal 2025. Speculation about a rate adjustment in early 2025 has not convinced markets, leading to continued weakness in the Yen. Japan’s Finance Minister, Katsunobu Kato, recently raised concerns over currency volatility, hinting at possible interventions. However, such measures have provided little lasting support to the JPY.
The broader market sentiment also leans against the Yen. A positive risk tone has reduced demand for safe-haven assets like the JPY, while the USD remains resilient even in the face of softer US consumer confidence data.
USD/JPY Technical Outlook: Key Levels to Watch
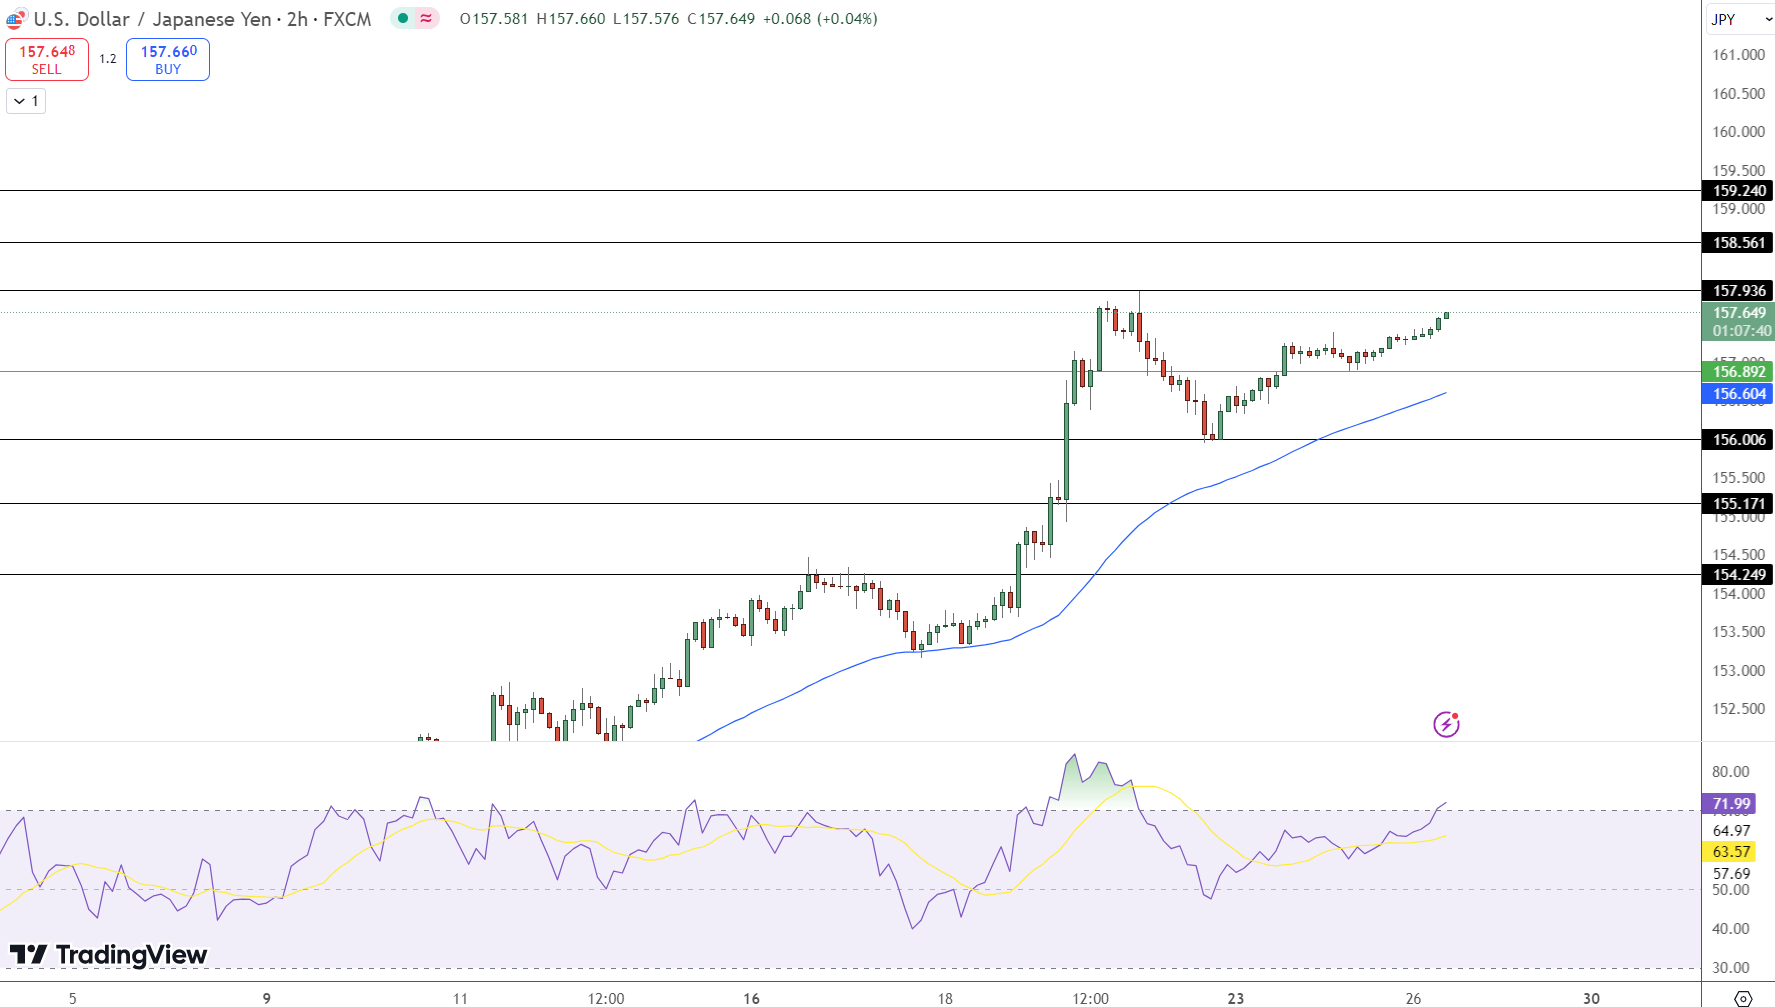
The USD/JPY is trading at 157.361, up 0.04%, staying above its pivot point at 156.932. Immediate resistance is at 157.923, with higher targets at 158.742 and 159.672 if the bullish trend persists. On the downside, immediate support lies at 155.965, followed by 155.004 and 154.152.
-
RSI: The Relative Strength Index at 65 indicates strong bullish momentum but nears overbought territory.
-
50-Day EMA: Positioned at 156.769, the EMA offers dynamic support for the pair’s upward trajectory.
Traders should monitor a break above 157.923 to confirm further gains, while a reversal below the pivot may signal a bearish pullback.
- Check out our free forex signals
- Follow the top economic events on FX Leaders economic calendar
- Trade better, discover more Forex Trading Strategies
- Open a FREE Trading Account
- Read our latest reviews on: Avatrade, Exness, HFM and XM
Related Articles


Sidebar rates
Related Posts
