Gold Price Outlook: Key Catalysts Driving Movement Amid Record Highs in 2024
Gold prices eased slightly, trading at $2,606.70 per ounce, down 0.08% amid light holiday activity. Market participants remain cautious...

Gold prices eased slightly, trading at $2,606.70 per ounce, down 0.08% amid light holiday activity.

Market participants remain cautious, anticipating next week’s critical U.S. economic data releases, including job openings, the ADP employment report, December’s FOMC minutes, and the U.S. jobs report.
These indicators will provide clarity on the Federal Reserve’s interest rate strategy for 2025 and set the tone for broader economic expectations under President-elect Donald Trump’s administration.
This year, gold has surged 27%, reaching an all-time high of $2,790.15 on October 31. Factors driving the rally include geopolitical uncertainty, central bank gold purchases, and three rate cuts by the Fed.
Despite the recent dip, analysts believe safe-haven demand will persist into 2025 as the U.S. grapples with rising debt levels and fiscal deficits.
Geopolitical Tensions and Policy Shifts Support Gold
As geopolitical risks intensify globally, gold remains a preferred hedge for investors. Central banks worldwide continue to amass gold, with net purchases hitting record highs in 2024.
The Trump administration’s anticipated economic policies, including potential tariffs, deregulation, and tax reform, are likely to add further uncertainty to global markets, enhancing bullion’s appeal.
Fed Chair Jerome Powell’s cautious stance on further rate cuts has also created mixed market sentiment. While high interest rates reduce the allure of non-yielding assets like gold, persistent inflation concerns and fiscal instability are expected to sustain gold’s safe-haven demand.
Gold Consolidates at Key Levels
Gold is holding above critical support at $2,603, with deeper levels at $2,583 and $2,562. On the upside, immediate resistance lies at $2,623, followed by $2,637 and $2,658.
The 4-hour chart indicates consolidation above a long-term ascending trendline, suggesting mild bullish support. However, gold’s price remains below its 50 EMA at $2,623, reinforcing short-term bearish momentum.
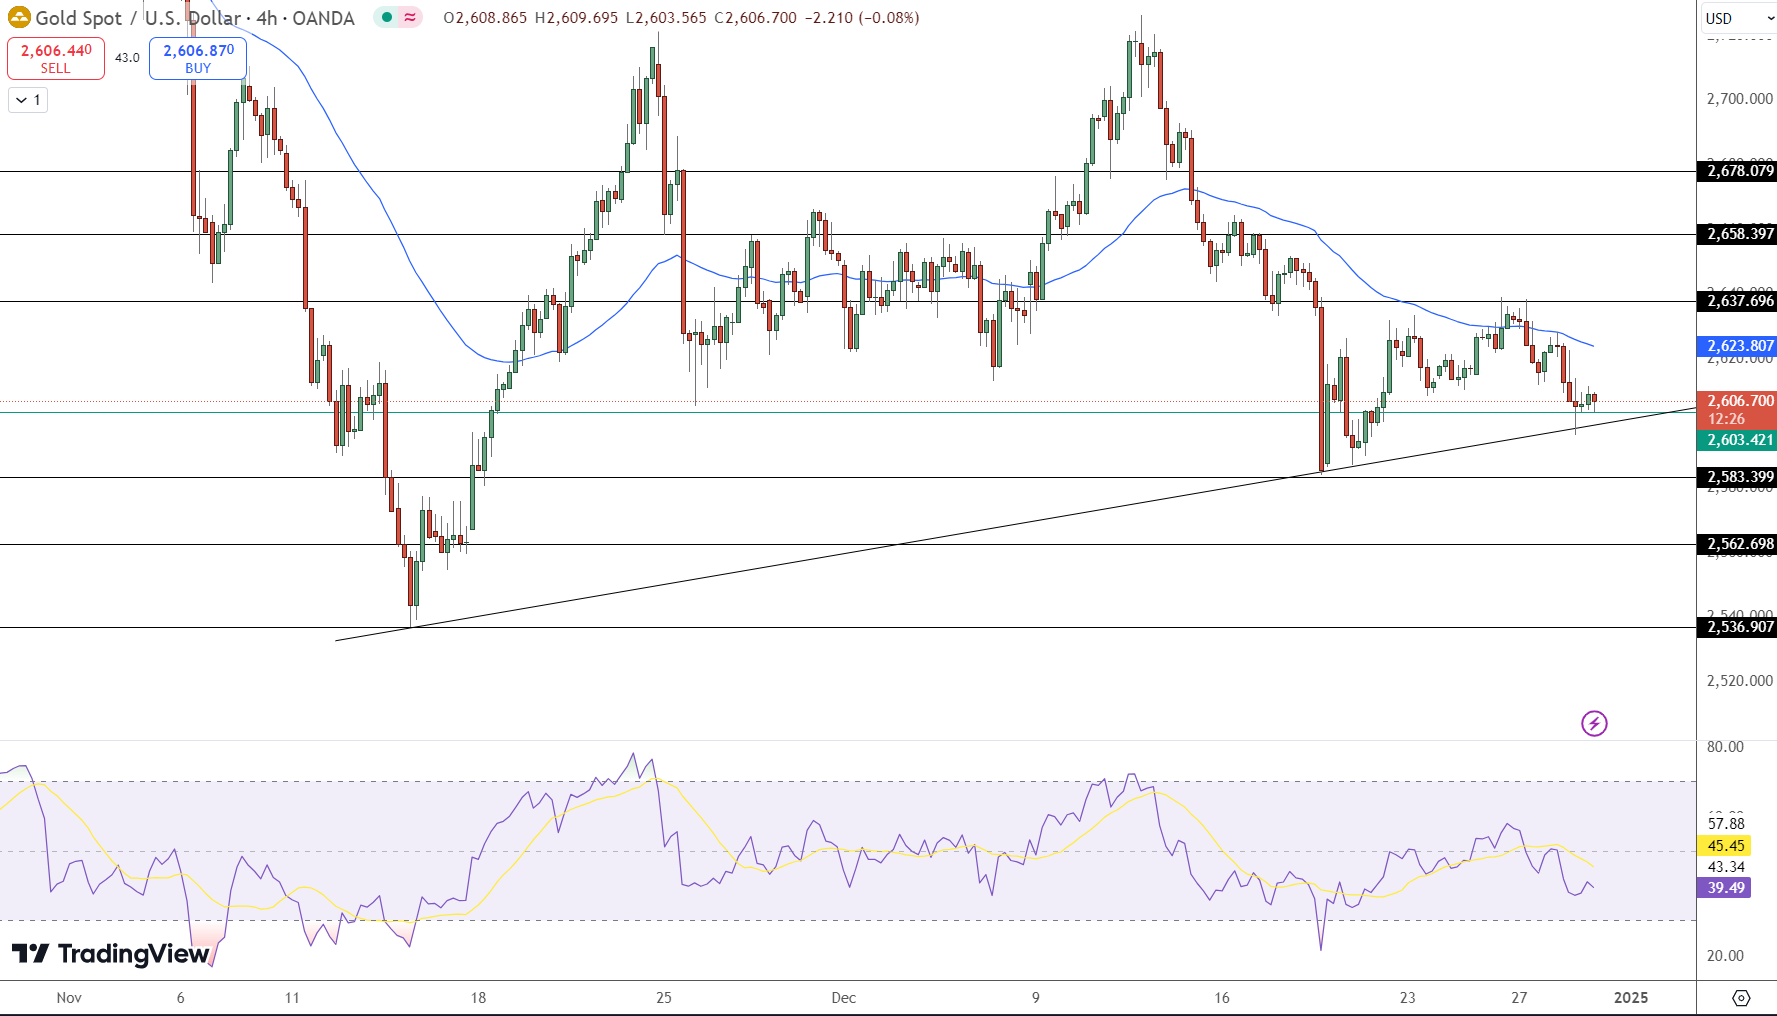
The RSI, currently at 39.49, reflects oversold conditions but lacks significant recovery signals. A break above $2,623 could open the door for further upside toward $2,658, while a dip below $2,603 risks sharp declines targeting $2,583.
Key Insights:
- Support Levels: Immediate at $2,603; deeper at $2,583 and $2,562.
- Resistance Levels: $2,623 is pivotal; next targets are $2,637 and $2,658.
- Momentum Indicators: RSI at 39.49 suggests oversold levels; price below 50 EMA signals continued bearish bias.
- Check out our free forex signals
- Follow the top economic events on FX Leaders economic calendar
- Trade better, discover more Forex Trading Strategies
- Open a FREE Trading Account