Gold Price Analysis: U.S. Dollar Weakness Fuels Gold’s $2,624 Stability
Gold prices ($XAU/USD) traded near $2,624 on Monday, reflecting a muted market tone as traders awaited significant U.S. economic data...

Gold prices ($XAU/USD) traded near $2,624 on Monday, reflecting a muted market tone as traders awaited significant U.S. economic data and policy updates.

With February gold futures rising slightly by $1.10 to $2,633, the precious metal has been supported by a strong ascending trendline since early December. However, thin holiday trading and looming uncertainties have capped any decisive movement, leaving the market in a consolidation phase.
The U.S. economic calendar remains a critical focus. Reports such as the Chicago ISM business survey and pending home sales may shape the Federal Reserve’s monetary policy outlook for 2025. Meanwhile, global stock indexes are mixed, and U.S. equities point to a softer opening as concerns about weaker demand and geopolitical uncertainty persist.
Mixed Momentum from Dollar and Treasury Yields
The U.S. dollar index weakened slightly on Monday, yet it is on track for its strongest annual gain in nearly a decade. This robust performance, supported by economic resilience and reduced expectations for deep rate cuts, has applied indirect pressure on gold.
In contrast, benchmark 10-year U.S. Treasury yields rose to 4.6%, reflecting investor caution. Crude oil prices, a key barometer of inflationary pressures, remain stable at $70.75 a barrel. These factors collectively influence gold’s appeal as a hedge, adding complexity to the market’s short-term outlook.
Gold’s Key Technical Levels to Watch
Gold’s technical landscape underscores a pivotal moment. Immediate resistance is observed at $2,628, with higher thresholds at $2,652 and $2,670. A successful breakout above these levels could pave the way for bullish momentum, driving prices toward $2,690.
On the downside, support levels are established at $2,602, $2,580, and $2,556, with the ascending trendline at $2,602 acting as a critical defense against bearish moves.
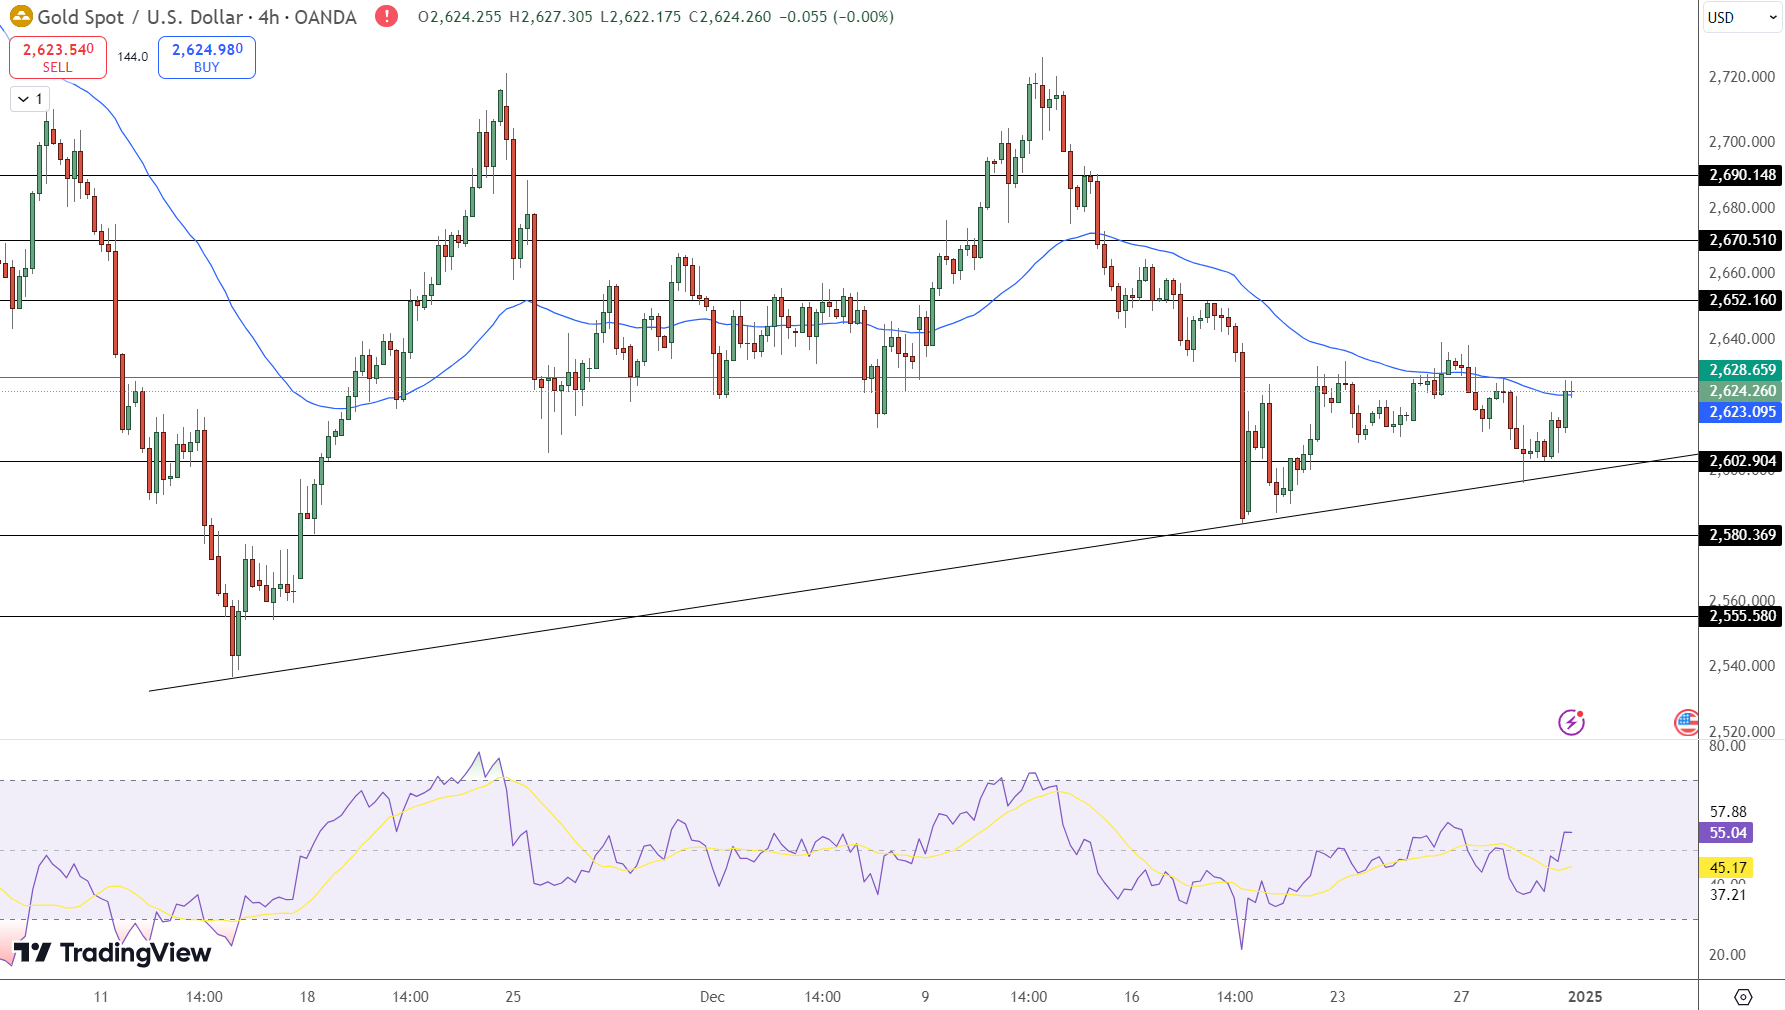
Key technical indicators offer mixed signals. Gold trades slightly below its 50-day EMA ($2,629), suggesting short-term consolidation. The RSI stands at 55.04, reflecting moderate bullish sentiment and signaling potential for a breakout if buying pressure increases.
Key Insights:
-
Immediate Resistance Levels: Gold faces resistance at $2,628, $2,652, and $2,670, which could limit upward movement.
-
Support Zones: Critical support is found at $2,602, $2,580, and $2,556, safeguarding against extended losses.
-
Market Momentum: RSI at 55.04 indicates moderate bullishness; gold remains below its 50 EMA at $2,629, showing consolidation.
- Check out our free forex signals
- Follow the top economic events on FX Leaders economic calendar
- Trade better, discover more Forex Trading Strategies
- Open a FREE Trading Account
- Read our latest reviews on: Avatrade, Exness, HFM and XM
Related Articles


Sidebar rates
Related Posts
