Forex Signals Brief January 15: US CPI Inflation Risks Point to the Downside for the USD
Today attention is on the US CPI inflation, which is expected to tick higher, but will likely miss, which will further weigh on the USD.
Today attention is on the US CPI inflation, which is expected to tick higher, but will likely miss, which will further weigh on the USD after yesterday’s soft PPI producer inflation which sent the Buck lower.
Yesterday, newsflow and data releases were relatively muted during the European trading session, with the exception of hints about possible gradual tariff hikes, which added pressure to the USD. The US PPI inflation report came in below expectations, further weakening the dollar. The equity markets displayed mixed sentiment, with US indices and European stocks showing conflicting trends. Treasury yields remained elevated as markets awaited the release of today’s US inflation report. Gold traded within a narrow range throughout the day, showing little movement following the volatility triggered by the recent NFP announcement.
The PPI Final Demand for December rose by 0.2% month-over-month, missing the 0.3% estimate and marking a decline from November’s 0.4%. Core PPI (excluding food and energy) came in flat at 0.0% MoM, falling short of the 0.3% forecast. On a year-over-year basis, PPI Final Demand inflation registered at 3.3%, slightly below the 3.4% expectation but higher than November’s 3.0%. These lower-than-expected figures supported the EUR/USD pair, which extended its gains during the US session, climbing above the 1.03 level.
Today’s Market Expectations
The UK Consumer Price Index (CPI) for the year is projected to increase slightly to 2.7%, up from the previous figure of 2.6%, while the Core CPI YoY is expected to decline marginally to 3.4% from 3.5%. On the market front, there’s a 65% chance of a 25 basis point rate cut at the next policy meeting, with 47 basis points of easing expected by year-end. If the CPI report comes in weaker than forecasted, the likelihood of a rate cut will strengthen, whereas higher-than-expected results could temporarily remove a cut from the table.
In the US, CPI expectations suggest a YoY increase to 2.8% from 2.7%, while the MoM reading is predicted to remain unchanged at 0.3%. Core CPI YoY is forecasted to stay steady at 3.3%, and the Core CPI MoM is anticipated to ease to 0.2% from 0.3%. This CPI report is regarded as the most critical economic release of the month and could lead to significant market turbulence, particularly given the current vulnerability in equities. Following the robust Non-Farm Payroll (NFP) data, markets now anticipate just one rate cut this year, compared to the Fed’s earlier projection of two cuts. The strong NFP numbers have raised concerns that the recent 50 basis point rate reduction may have been overly aggressive, leading to rapid market repricing in recent months.
Last week the USD started it on the back foot after the rumours for no tariffs, but on Tuesday the price action reversed and the USD resumed the larger uptrend, which made it easier for traders. We opened 28 trading signals in total, closing it with 20 winning forex signals and 8 losing ones.
Gold Consolidates Above MAs
Gold experienced a significant $100 drop last month after failing to breach the key resistance level at $2,725. Last week, the 50-day SMA acted as a resistance point, but when the price dipped below the 100-day SMA, buyers stepped in. Despite some recovery, gold initially struggled to climb above the 50-day SMA. On Wednesday, buyers managed to push the price above this level, and by yesterday, it had stabilized. However, renewed selling pressure caused XAU to lose $30, bringing it back to the 50-day SMA.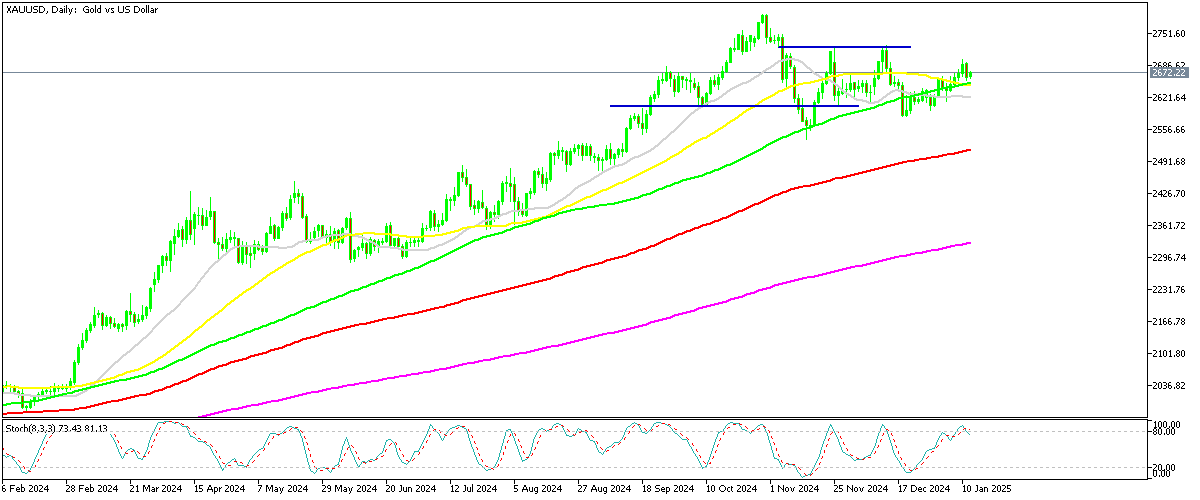
XAU/USD – Daily Chart
EUR/USD Faces MAs After Climbing to 1.03
EUR/USD has been going down in waves, following a pattern of lower lows and lower highs during retraces up. Early on Monday, the price fell below 1.02 as sellers piled in after the weekend, but the rumours about the slower tariffs weighed on the USD in the last two days, which sent this pair above 1.03 yesterday. However, buyers re facing the 50 SMA (yellow) and the 100 SMA (green) as resistance above, which look like good places to short this pair.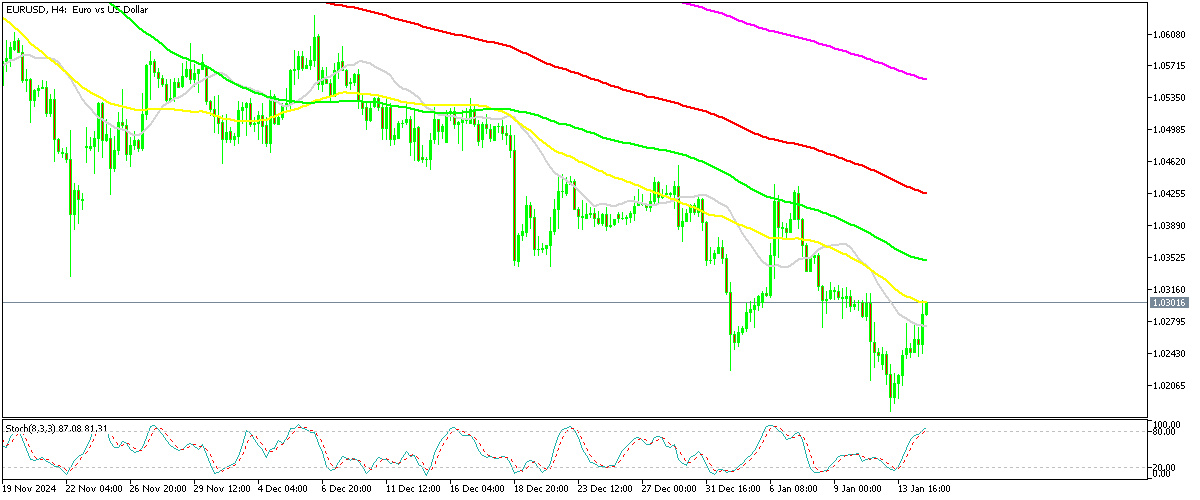
EUR/USD – Daily Chart
Cryptocurrency Update
Bitcoin Climbs Above $95K Again

BTC/USD – Daily chart
Ethereum Returns Above $3,000 After Dipping Below This Level
Ethereum was even more volatile, climbing from $3,000 to nearly $4,000 midweek before losing momentum and dropping below $3,500. Over the past two weeks, Ethereum regained some ground, finding strong support near the 50-day SMA. Yet renewed bearish sentiment caused it to slide below $3,500 again, eventually dropping to $3,200. A further sell-off briefly pushed the price below $3,000 on Monday, but buyers re-entered during the US session, driving a decent recovery which continued yesterday.
ETH/USD – Weekly Chart
- Check out our free forex signals
- Follow the top economic events on FX Leaders economic calendar
- Trade better, discover more Forex Trading Strategies
- Open a FREE Trading Account
- Read our latest reviews on: Avatrade, Exness, HFM and XM
Related Articles


Sidebar rates
Related Posts
