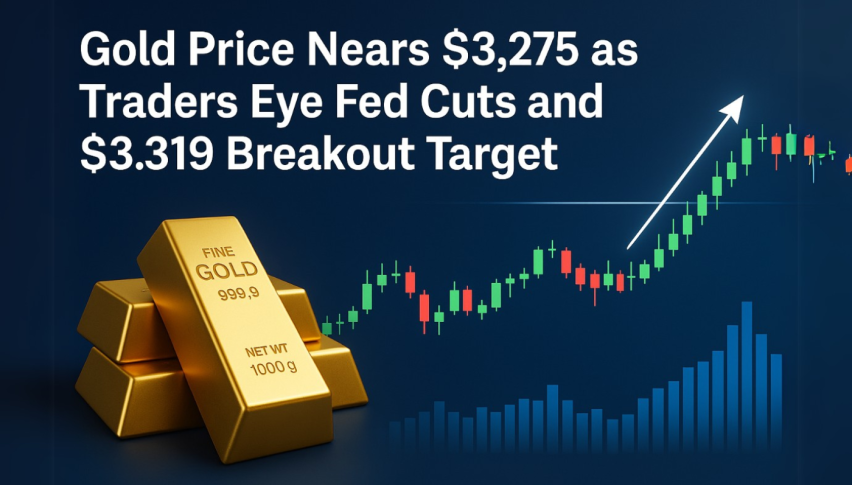
Gold Price Nears $3,275 as Traders Eye Fed Cuts and $3,319 Breakout Target
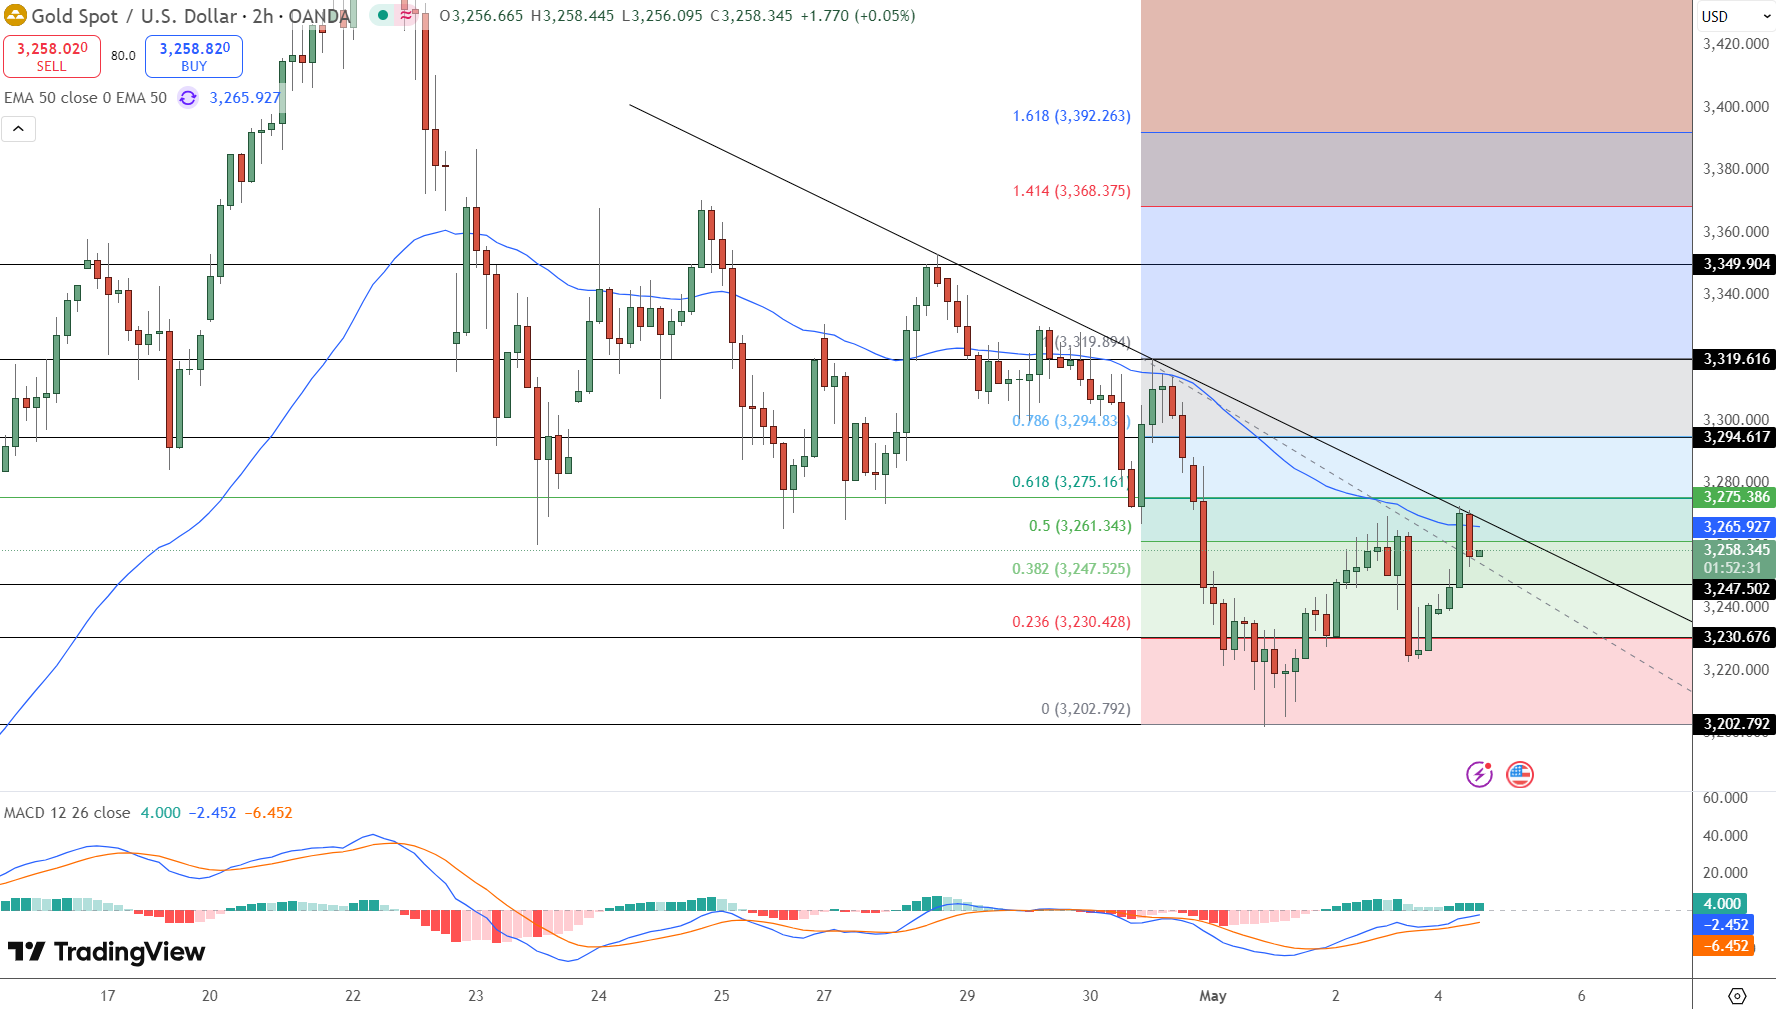
Gold is looking strong at $3,265 as the dollar weakens and the Fed decision looms. The dollar index (DXY) is down 0.3% making gold more...
Quick overview
- Gold is currently strong at $3,265 due to a weakening dollar and anticipated Fed rate cuts.
- Traders are closely watching the $3,275 level, as a break above could lead to further gains.
- Technical indicators suggest a breakout setup, with key support at $3,247 and resistance at $3,275.
- Volume confirmation is crucial for traders to avoid false moves near trendlines.
Gold is looking strong at $3,265 as the dollar weakens and the Fed decision looms. The dollar index (DXY) is down 0.3% making gold more attractive to global investors. Timing couldn’t be more perfect after the strong jobs report in April.
CME FedWatch has traders pricing in 80 basis points of rate cuts this year with July as the likely start. Low rates are good for gold. As a non-yielding asset, gold does well when rates fall and cash returns decline.
On the geopolitical front, US-China trade is back in the spotlight. President Trump said Sunday he wants “fair trade” with China and has no plans to fire Fed Chair Jerome Powell before his term ends in 2026 and is still pushing for rate cuts.
Traders Watch $3,275 Level Closely
From a technical standpoint, gold is right at a confluence zone. Price is touching the 50-period exponential moving average (EMA) at $3,266 and the descending trendline that’s capped recent rallies. The 61.8% Fibonacci retracement of the $3,202 to $3,319 move adds to the importance of this zone.
MACD is turning up but confirmation is needed. A break above $3,275 could open up $3,294 and $3,319—a range that’s been tested multiple times recently.
Key Levels to Watch:
-
Resistance: $3,275 → $3,294 → $3,319
-
Support: $3,247 → $3,230 → $3,202
-
EMA (50): $3,266
-
MACD: Turning up but early
Gold Trade Setup
This is a breakout setup for traders who want confirmation before entering. If price breaks and holds above $3,275 on good volume, bulls may come in with momentum to push price to recent highs. But if rejected here, gold may slide to $3,230 support.
Trade Setup:
-
Entry (Bullish): Break and close above $3,275
-
Target (Upside): $3,294 → $3,319
-
Entry (Bearish): Close below $3,247
-
Target (Downside): $3,230 → $3,202
-
Stop Loss: Beyond the breakout or breakdown wick
Trade Tip: Let the candle close above or below the level before entering. Volume confirmation is key to filter out false moves especially near trendlines.
- Check out our free forex signals
- Follow the top economic events on FX Leaders economic calendar
- Trade better, discover more Forex Trading Strategies
- Open a FREE Trading Account
- Read our latest reviews on: Avatrade, Exness, HFM and XM
Related Articles
Sidebar rates
