Berkshire Hathaway (BRK.B) Stock Surges: What’s Driving the Recent Growth?
•
Last updated: Wednesday, June 4, 2025

Quick overview
- Berkshire Hathaway (BRK.B) stock has increased by 240% since its low in 2020, but recent performance indicates a potential correction phase.
- Despite a strong rally last month, technical indicators show mixed signals with bearish MACD ticks and a neutral RSI.
- Key support levels are identified between $468 and $492, while resistance is noted near $538.
- Long-term indicators remain bullish, suggesting that any short-term pullback may occur within an overall positive trend.
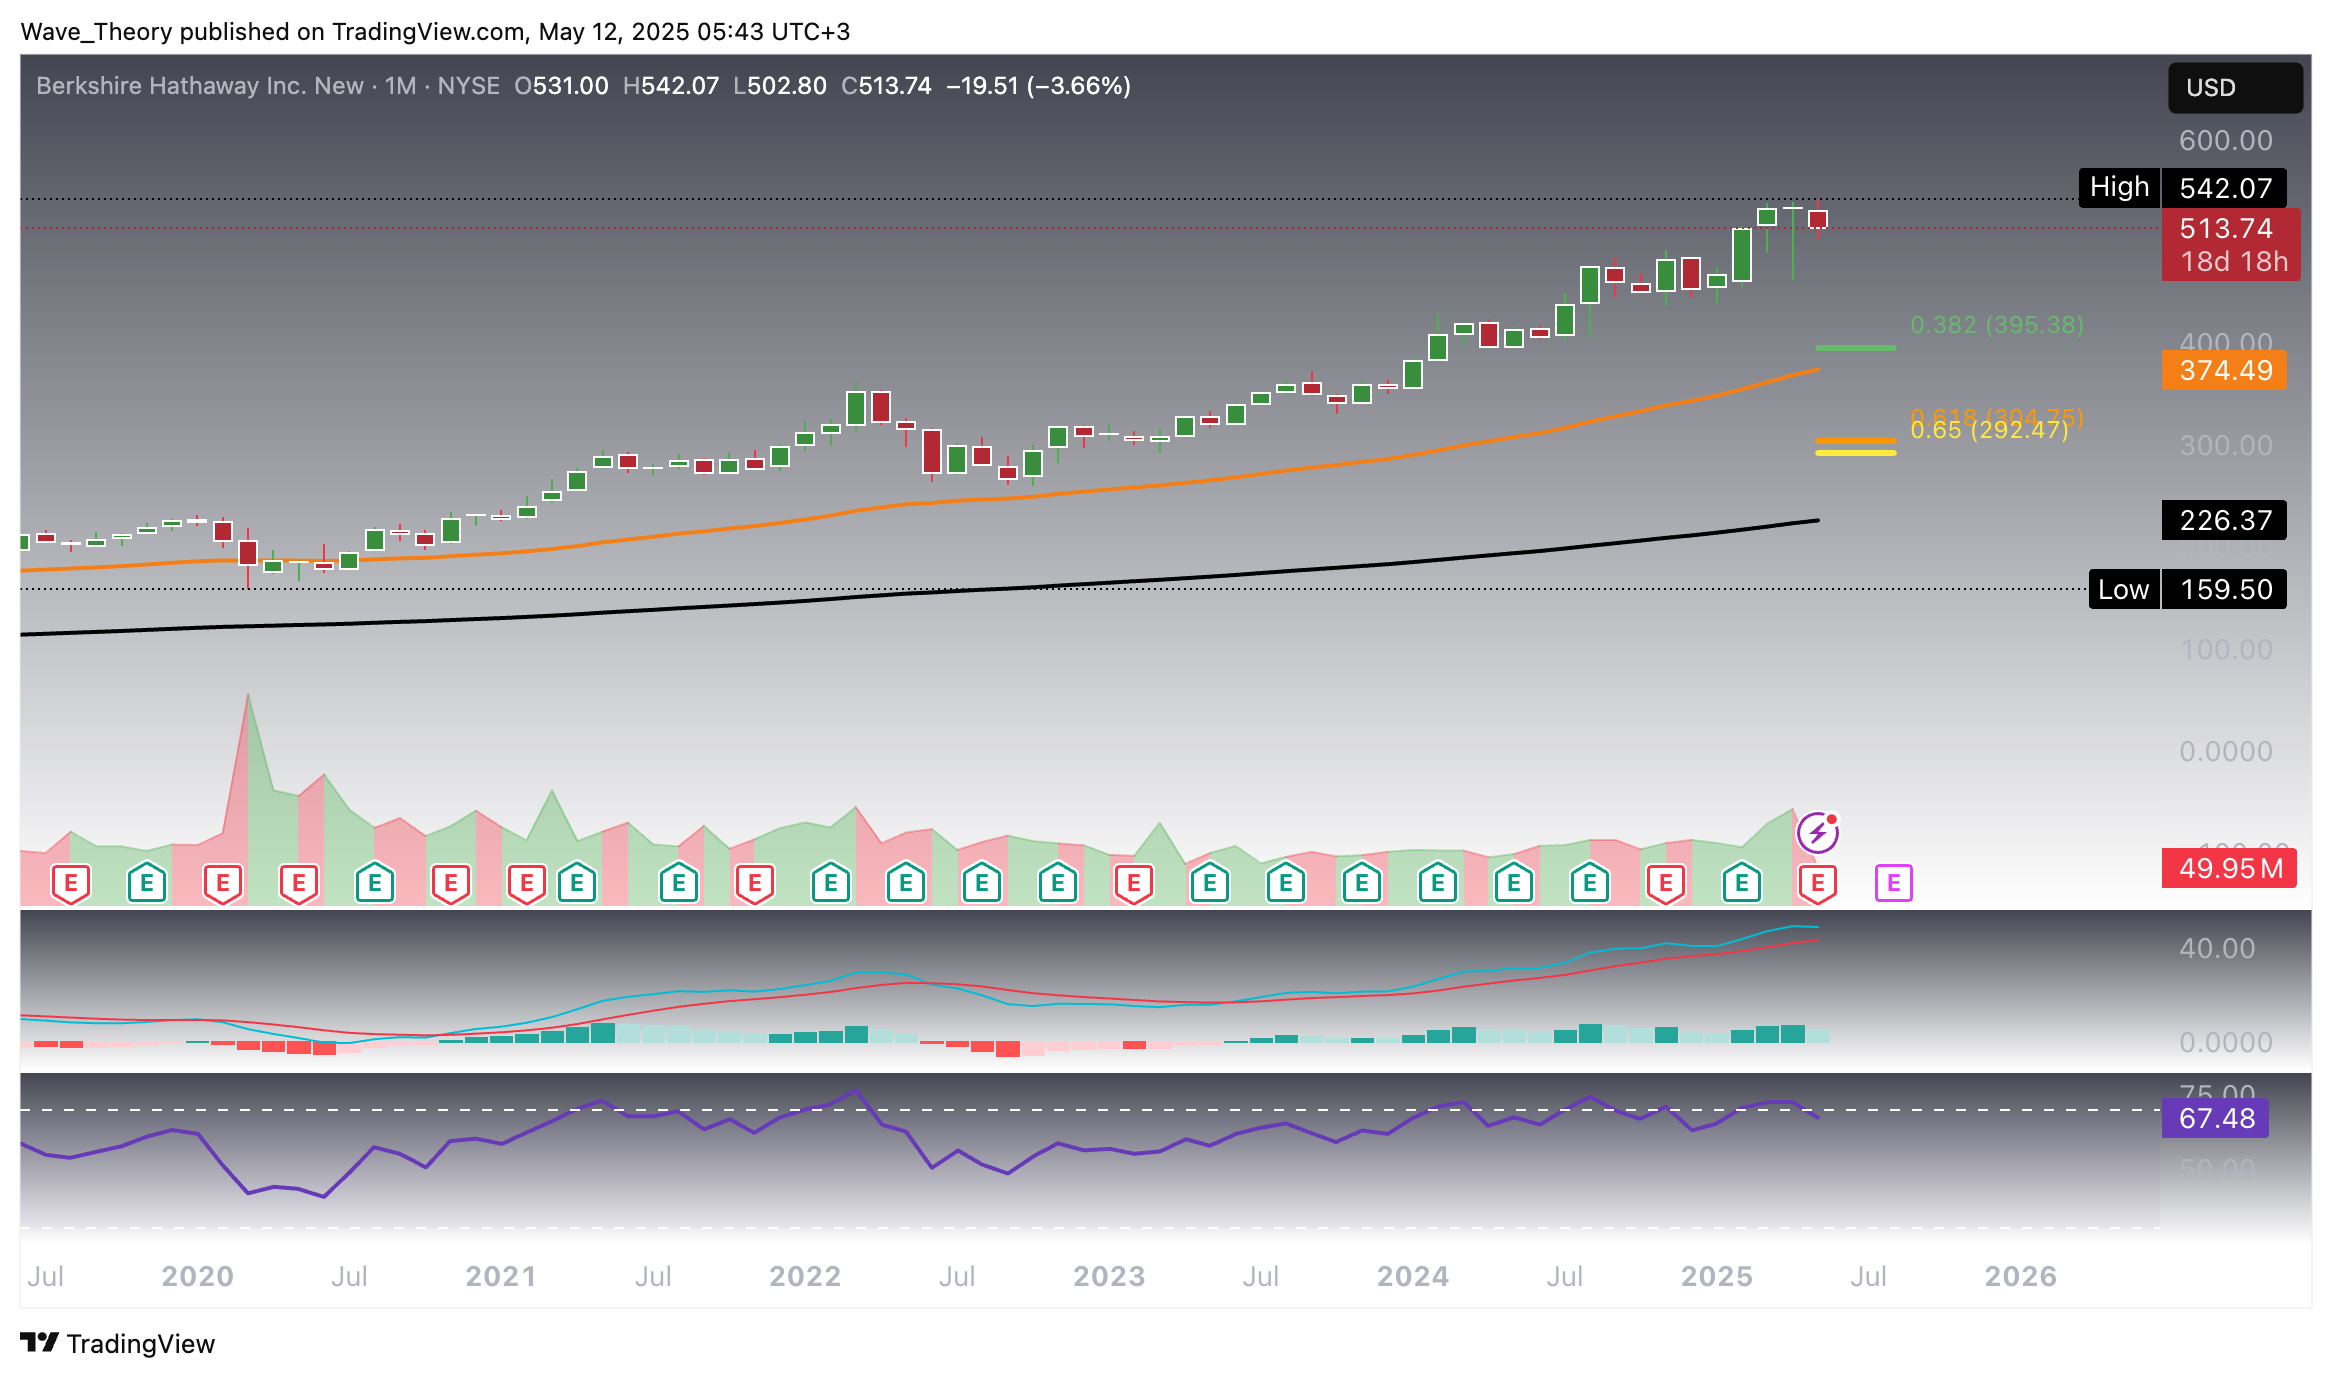
Since hitting a low of $159.50 in 2020, Berkshire Hathaway (BRK.B) stock has soared by an impressive 240%. After a volatile performance last month, signs now point to the beginning of a potential correction phase.
Berkshire Hathaway (BRK.B) Stock: Momentum Cools After Strong Rally
Berkshire Hathaway (BRK.B) posted an impressive surge of over 17% last month, yet the candle closed with only a marginal gain over its opening, signaling waning momentum. This month, signs of a potential correction are emerging, as the MACD histogram begins to tick bearishly lower after three consecutive months of bullish momentum. The RSI has also retreated from overbought levels back into neutral territory, supporting the possibility of a short-term pullback.
Despite these cautionary signals, the broader trend remains intact: both the MACD lines and EMAs are still bullishly crossed, underscoring long-term strength. Should a correction unfold, key Fibonacci support levels lie at $395 and $300, with the 50-month EMA providing additional support around $375.
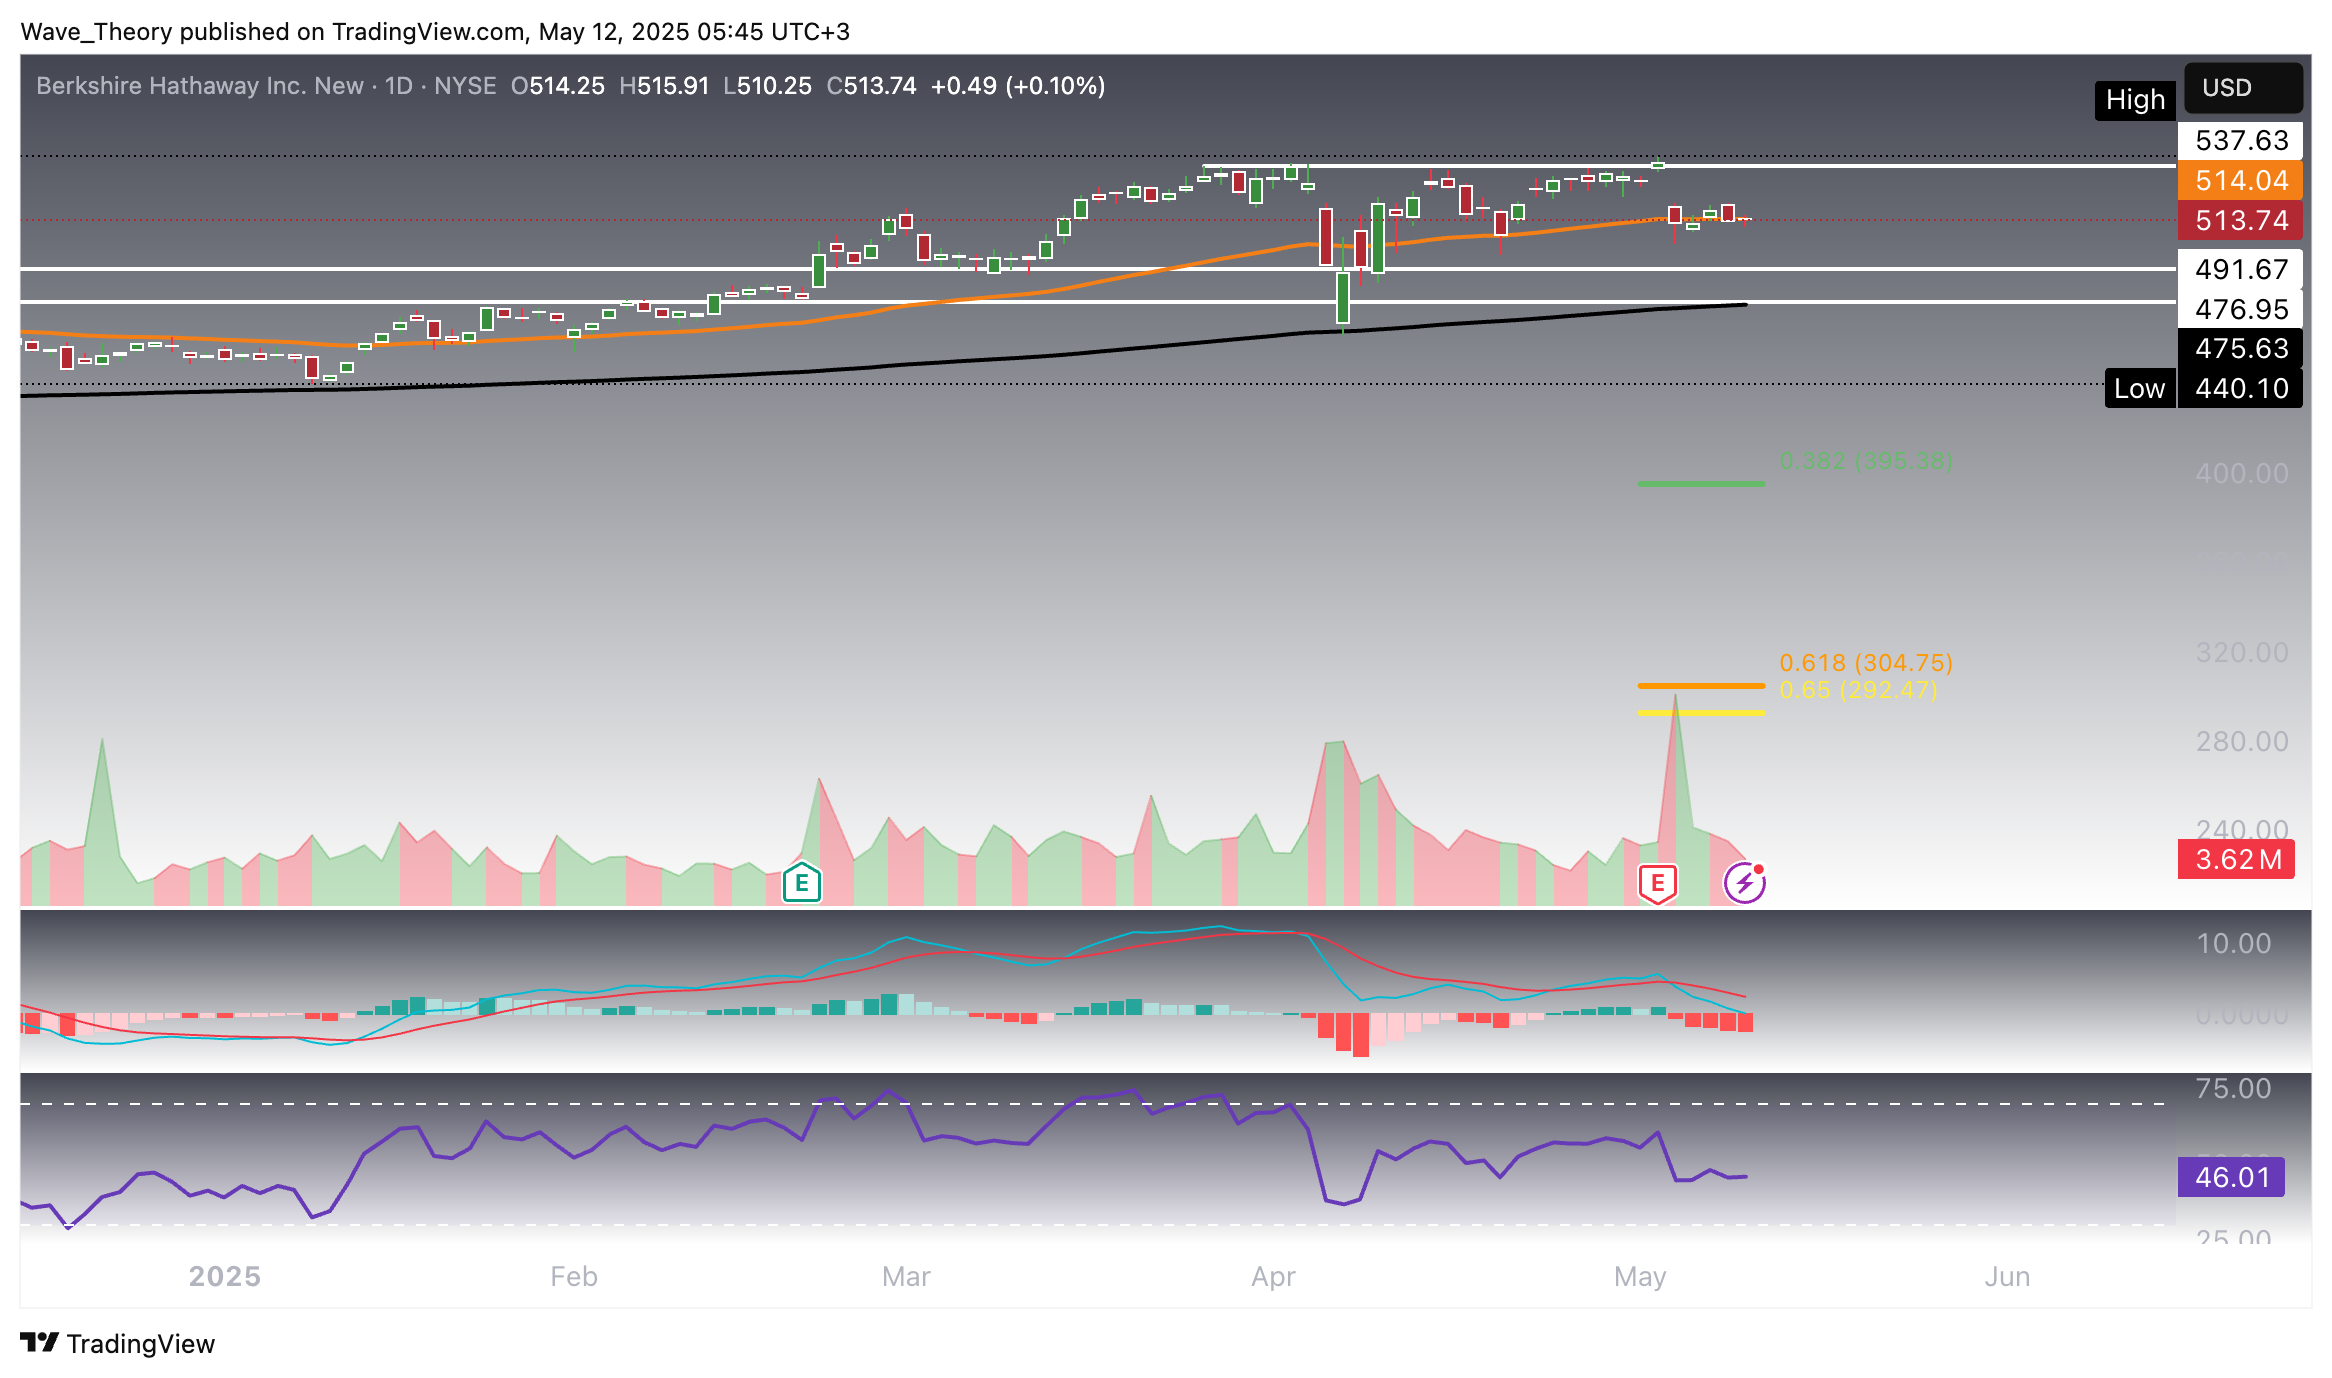
Berkshire Hathaway (BRK.B) Stock Shows Mixed Signals on Daily Chart
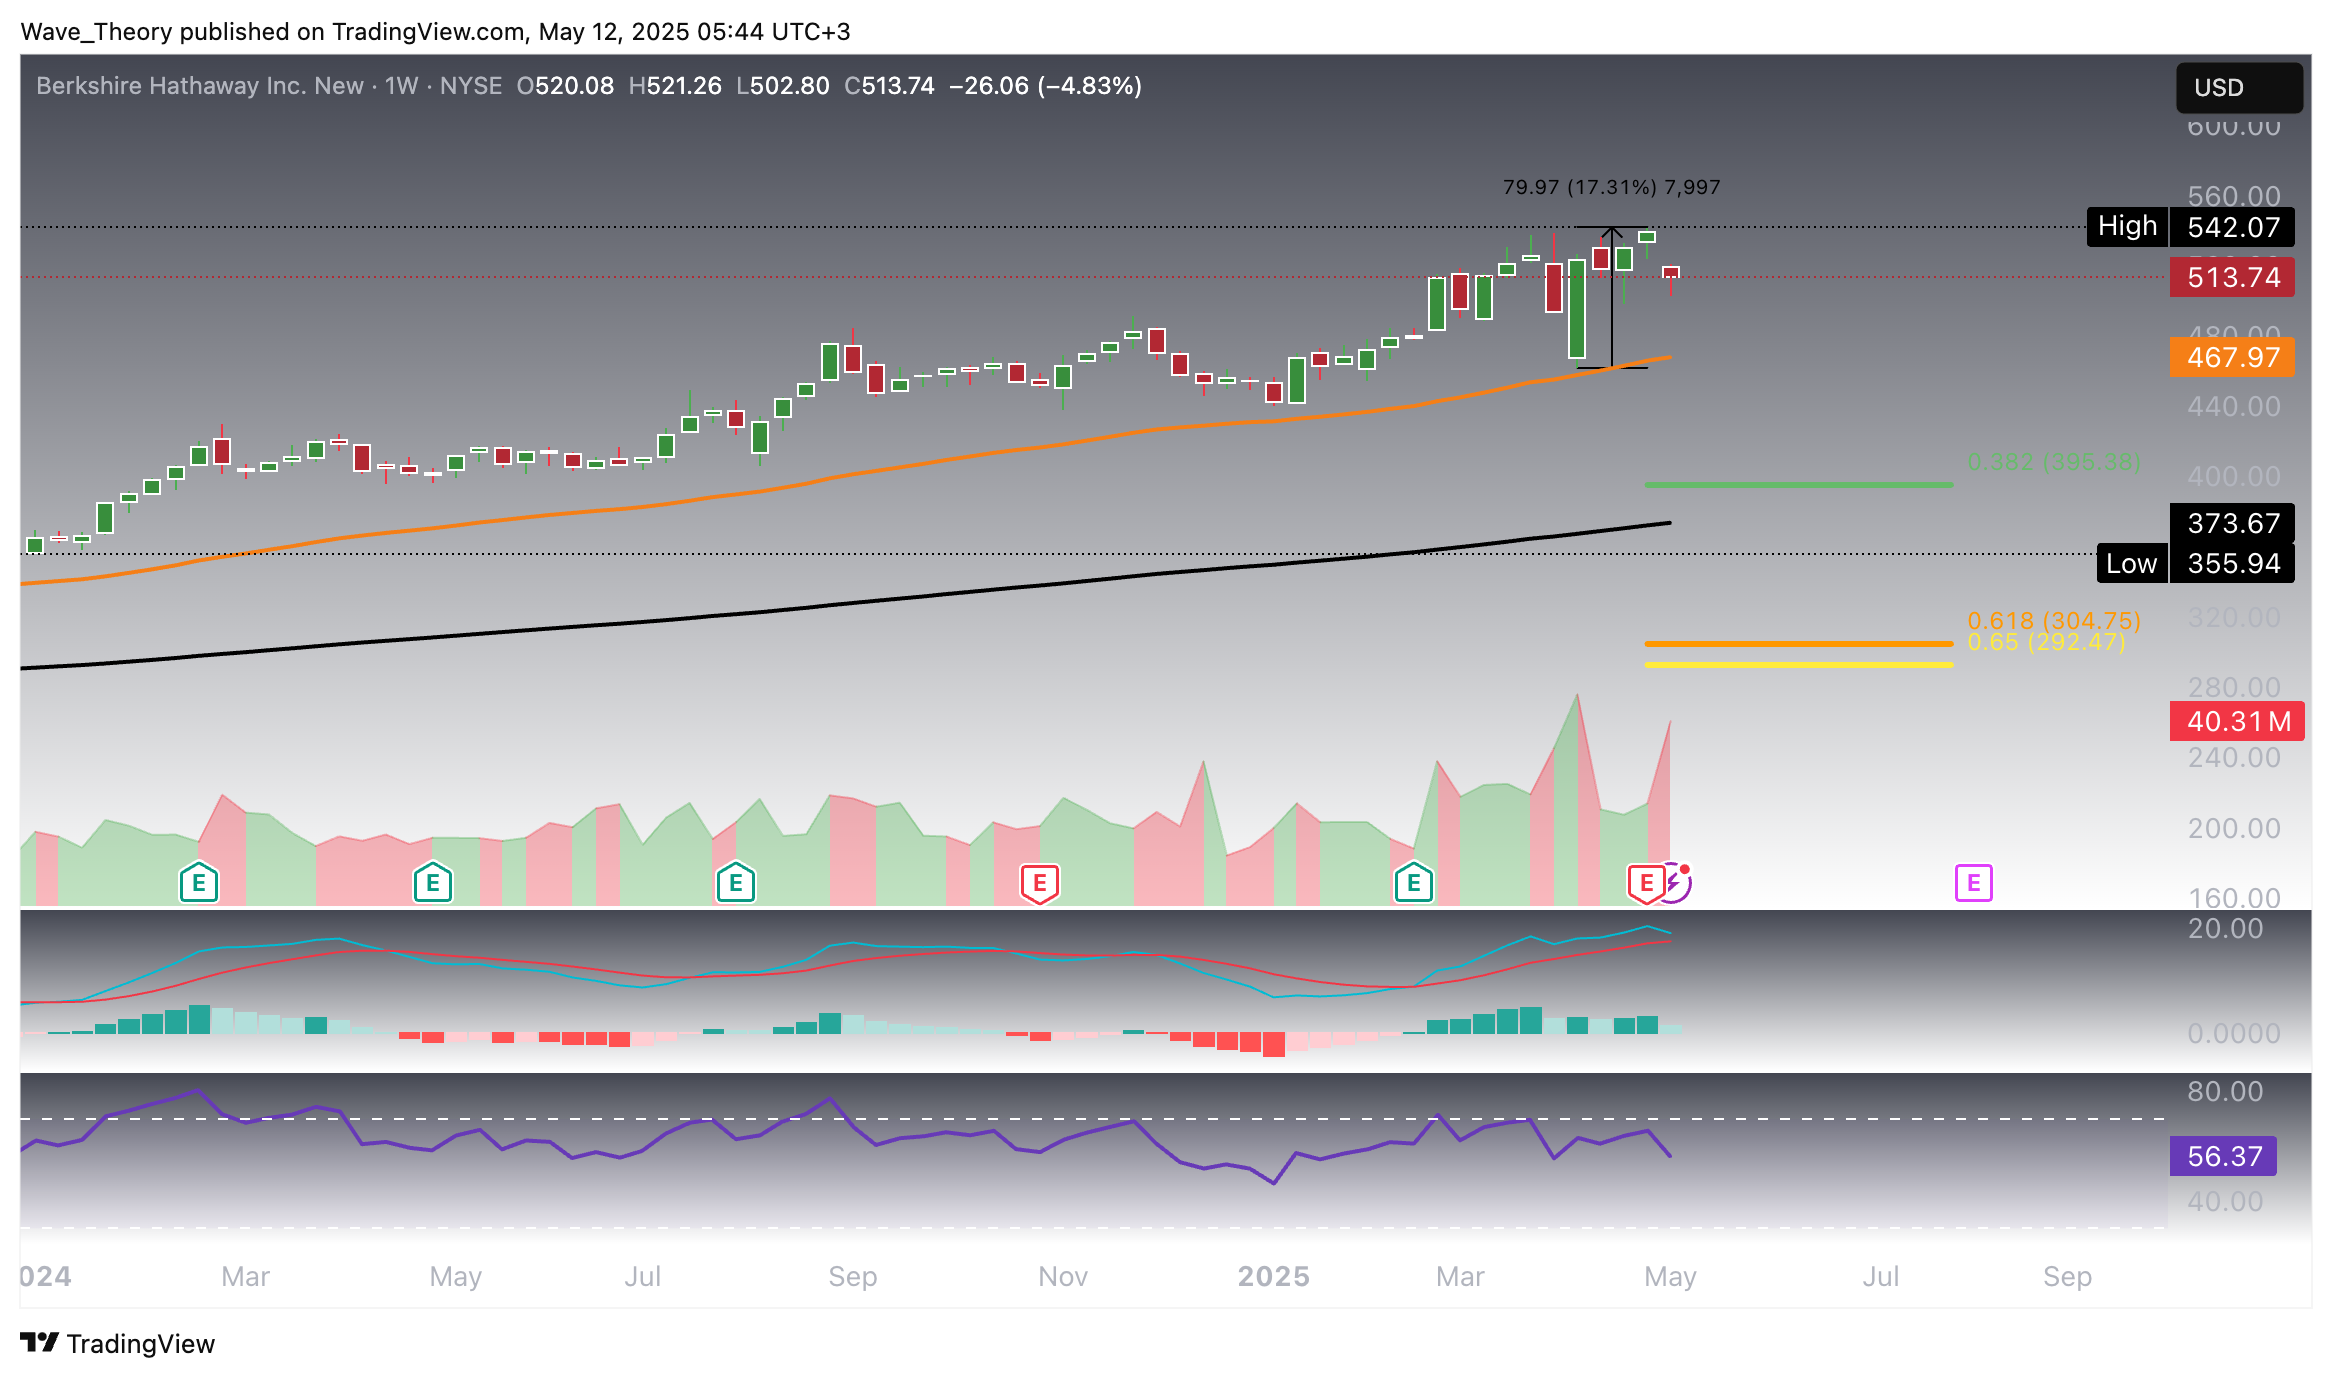
Berkshire Hathaway (BRK.B) presents a mixed technical picture on the daily chart. The MACD lines are bearishly crossed with the histogram trending lower, suggesting short-term bearish momentum. Meanwhile, the RSI remains neutral, offering no clear directional bias. However, the EMAs still maintain a golden crossover, indicating the underlying trend remains bullish in the short- to medium term. Key resistance lies at $538, while significant support is found between $477 and $492.
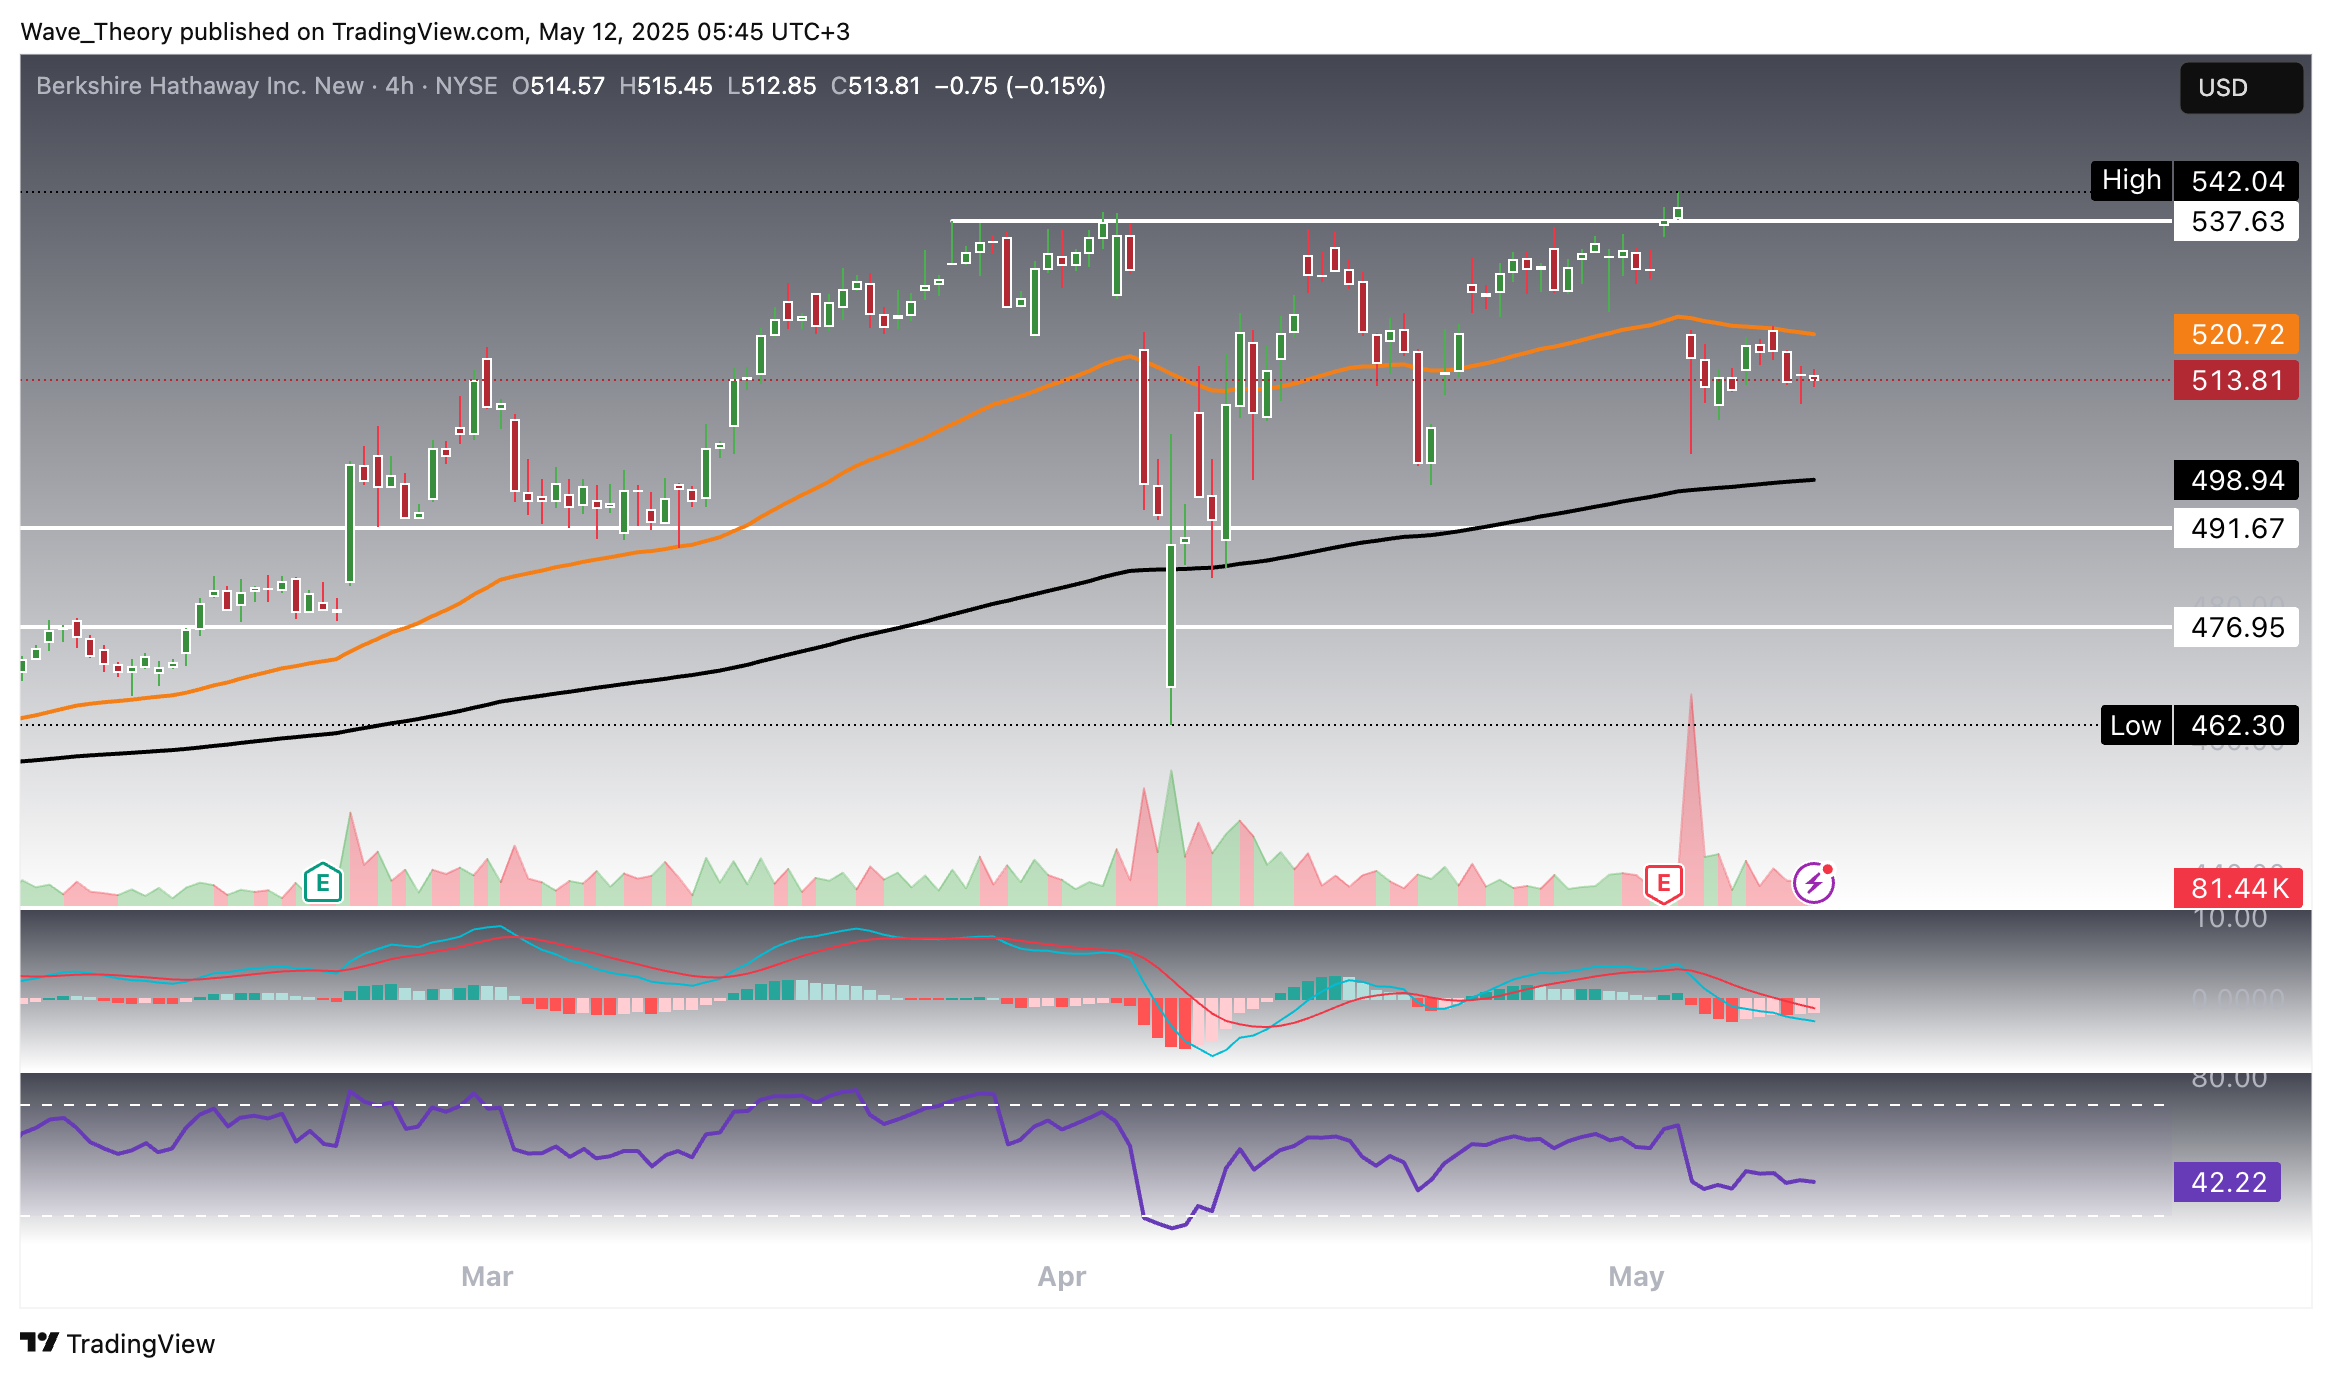
Berkshire Hathaway (BRK.B) 4H Chart: More Mixed Signals Ahead
On the 4-hour chart, Berkshire Hathaway (BRK.B) displays further mixed signals. While the MACD histogram begins to tick bullishly higher, the MACD lines remain bearishly crossed, suggesting lingering short-term weakness. The RSI holds in neutral territory, and the EMAs continue to show a golden crossover, reaffirming the short-term bullish trend. Price action in the coming days may be choppy, with potential downside pressure within a broader bullish structure.
Summary
Berkshire Hathaway (BRK.B) has surged 240% since its 2020 low, recently showing signs of a potential correction after strong gains. While long-term indicators like the MACD lines and EMAs remain bullish, shorter timeframes reveal mixed signals—bearish MACD ticks, neutral RSI, and resistance near $538. Key support lies between $468–$492, suggesting choppy movement ahead within an overall bullish structure.
- Check out our free forex signals
- Follow the top economic events on FX Leaders economic calendar
- Trade better, discover more Forex Trading Strategies
- Open a FREE Trading Account
ABOUT THE AUTHOR
See More
Konstantin Kaiser
Financial Writer and Market Analyst
Konstantin Kaiser comes from a data science background and has significant experience in quantitative trading. His interest in technology took a notable turn in 2013 when he discovered Bitcoin and was instantly intrigued by the potential of this disruptive technology.