WTI Crude Sinks to $61.10 as Iran Deal Talks and U.S. Stockpiles Weigh
Crude oil prices plummeted by more than $1 on Thursday to $61.10. That's after an Iranian official—interviewed by NBC

Quick overview
- Crude oil prices fell over $1 to $61.10 following news of potential U.S.-Iran nuclear negotiations that could ease sanctions on Iranian oil.
- A surprise increase in U.S. crude inventories by 3.5 million barrels has contributed to bearish sentiment among traders.
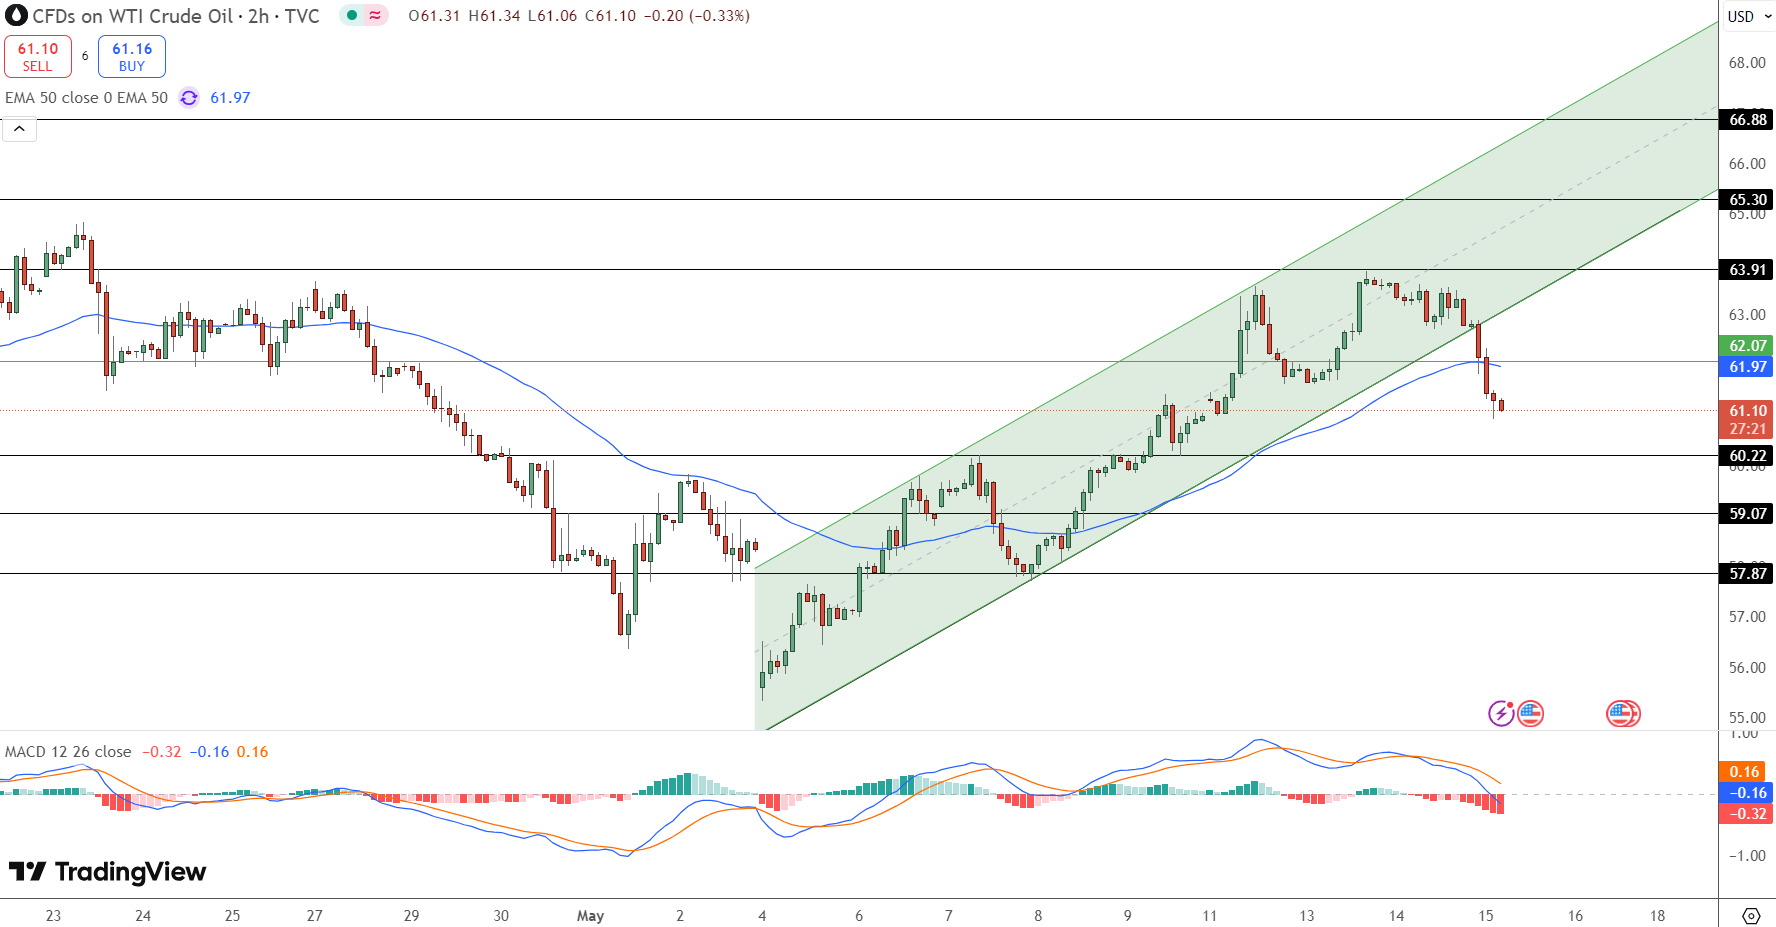
- Technical indicators show WTI has broken out of its bullish channel, suggesting a potential downtrend in prices.
- Traders are advised to consider short positions if prices retest $61.90-$62.10, with targets set at $60.22 and $59.07.
Crude oil prices plummeted by more than $1 on Thursday to $61.10. That’s after an Iranian official—interviewed by NBC—said Iran is open to a nuclear agreement in exchange for easing U.S. sanctions. That news sparked fears a deal could bring sanctioned Iranian oil back into global markets, further straining already fragile supply-demand dynamics.
Nomura economist Yuki Takashima says fresh selling was triggered by expectations that a U.S.-Iran nuclear deal would ease U.S. sanctions on Iran. That, in turn, could loosen the global crude supply-demand balance.
Saudi Arabia is supporting those negotiations, which has boosted optimism around a diplomatic breakthrough. But the U.S. Treasury just announced new sanctions targeting Iranian ballistic missile components. That shows tensions remain.
Surprise Inventory Build Fuels Bearish Sentiment
A surprise crude stockpile build rattled traders. U.S. Energy Information Administration data showed a 3.5 million barrel increase in crude inventories for the week ending May 9. That’s well above analyst forecasts of a 1.1 million barrel draw. API data echoed that, showing a 4.3 million barrel build.
Tony Sycamore of IG notes that profit-taking is kicking in after crude approached the top of its $55-$65 range. Without a fresh shock, the break will likely be to the downside—possibly to $50.
OPEC+ is still gradually increasing supply, but it’s cut its growth forecast for non-member producers. That adds another layer of uncertainty to the global oil outlook.
The Charts—and What They Mean – WTI Outlook
From a charting perspective, WTI has broken out of its bullish channel and fallen below the 50-period moving average on the 2-hour chart. The momentum indicator has also flipped bearish, confirming the downtrend.

That technical breakdown, combined with bearish macro drivers, opens the door for continued weakness in crude. Momentum traders should be on high alert—especially ahead of further geopolitical headlines or inventory releases.
When it’s time to act, consider short positions on a retest of $61.90-$62.10. Your targets are $60.22 and $59.07. Place your stop-loss above $62.50.
- Check out our free forex signals
- Follow the top economic events on FX Leaders economic calendar
- Trade better, discover more Forex Trading Strategies
- Open a FREE Trading Account


