btc-usd
Forex Signals Brief June 9: Inflation and GDP – What to Watch in Global Forex
In a busy macro week, global markets anticipate data on US CPI and PPI inflation, GDP figures, and central bank signals.
•
Last updated: Monday, June 9, 2025

Quick overview
- Global markets are preparing for significant U.S. inflation updates and GDP readings, which could influence central bank policies.
- Despite disappointing labor market data, U.S. equity markets rebounded strongly, with the Dow Jones nearing recent highs.
- This week features key economic indicators from various countries, including U.S. CPI and European GDP figures, likely to impact market volatility.
- In the cryptocurrency space, Bitcoin and Ethereum have shown notable movements, with Bitcoin facing resistance at $110,000 and Ethereum struggling against key moving averages.
Live BTC/USD Chart
BTC/USD

0.0000
MARKETS TREND
In a busy macro week, global markets anticipate data on US CPI and PPI inflation, GDP figures, and central bank signals.
Despite underwhelming labor market data, U.S. equity markets staged a strong comeback by Friday’s close, led by the Dow Jones Industrial Average. The index challenged a key resistance zone once again and finished the week close to its recent highs. While May’s non-farm payrolls headline figures came in above forecasts, a closer look revealed a less optimistic picture beneath the surface, including downward revisions and soft details. Paradoxically, this weaker tone supported the notion that the Federal Reserve may lean more dovish moving forward, spurring a wave of buying across equities.
The strength into Friday’s session suggested that mid-week concerns—sparked by disappointing ADP private payrolls data—had largely faded. Risk appetite returned decisively, as investors grew more confident that softer data might trigger policy support rather than economic decline.
Weekly Forex Outlook (June 10–14): CPI, GDP and Central Bank Clues Dominate Forex Week
This week offers a rich mix of inflation data, GDP figures, and sentiment indicators that will guide expectations for central bank policy paths. Wednesday’s US CPI release will likely dominate markets, but European wage and GDP figures will also shape rate outlooks for the ECB and BoE. Investors should brace for short bursts of volatility, particularly toward Friday’s Quad Witching session.
Monday – June 10
- Japan: Q1 Revised GDP – Market participants will watch for any upward revision to Japan’s preliminary 0.5% QoQ contraction.
- China: May CPI & PPI – Key data on deflationary pressures and producer activity may impact the yuan and risk sentiment in Asia.
- China: May Trade Balance – Export/import trends could signal global demand strength or weakness.
- Eurozone: June Sentix Investor Confidence – Sentiment toward the euro area economy amid improving inflation trends.
- US: May Employment Trends Index – Follows Friday’s NFP; may give a further read on labor market momentum.
Tuesday – June 11
- UK: April Labor Market Report – Focus on wage growth and unemployment rate; key for BoE rate expectations.
- Sweden: April GDP – Important for the SEK as markets assess the pace of the Riksbank’s dovish shift.
- Norway: May CPI – Crucial for rate trajectory with Norges Bank increasingly data dependent.
- US: EIA Short-Term Energy Outlook – May influence inflation expectations via energy price forecasts.
Wednesday – June 12
- Eurozone: ECB Wage Tracker – Closely watched ahead of July’s ECB meeting; wage pressure remains a key inflation risk.
- US: May CPI Report – The highlight of the week. A softer-than-expected print could fuel bets on Fed rate cuts later this year.
- UK: Fiscal Spending Review – Policy changes may affect GBP through growth and deficit expectations.
Thursday – June 13
- UK: April GDP – After weak March numbers, markets look for signs of Q2 rebound.
- US: May PPI – Producer price data adds depth to the inflation picture following CPI, with potential knock-on effects for USD and equities.
Friday – June 14
- France & Spain: Final May CPI – To confirm or revise flash estimates, providing clarity on inflation divergence within the euro area.
- Eurozone: April Trade Balance – External demand and export recovery under scrutiny.
- US: University of Michigan Consumer Sentiment (June, prelim) – Inflation expectations components may move yields and the dollar.
- Quadruple Witching Day – Options and futures expiry could cause short-term volatility spikes across equities, FX, and indices.
Last week, markets were slower than what we’ve seen in recent months, with gold retreating as a result, the EUR/USD jumping close to 1.15 but returned back to 1.14 this week, and stock markets continued upward too. The moves weren’t too big, but we opened 37 trading signals in total, finishing the week with 25 winning signals and 12 losing ones.
Gold Retreat Toward the 50 SMA Again
In the precious metals space, gold remains in a consolidation phase but continues to find firm technical support. The 50-day simple moving average, now positioned around $3,255, has been a consistent anchor for the market. As prices retest this level, traders are watching closely for signs of stabilization or a potential bullish reversal. The metal has been confined in a broad range since late April, reflecting uncertainty but also tightening volatility. A breakout above $3,400 could pave the way for a fresh test of April’s $3,500 peak, while a dip toward $3,120 may invite fresh buyers.

USD/JPY Defies Yield Trend as Capital Flows Shift
A curious divergence occurred in USD/JPY trading. Despite falling U.S. Treasury yields, the pair climbed from 143.40 to 144.31. Analysts attribute the move to capital outflows from Japan and large-scale portfolio adjustments, rather than interest rate dynamics. Geopolitical factors and market sentiment appear to be the primary drivers in this instance, underscoring a shift in traditional correlations.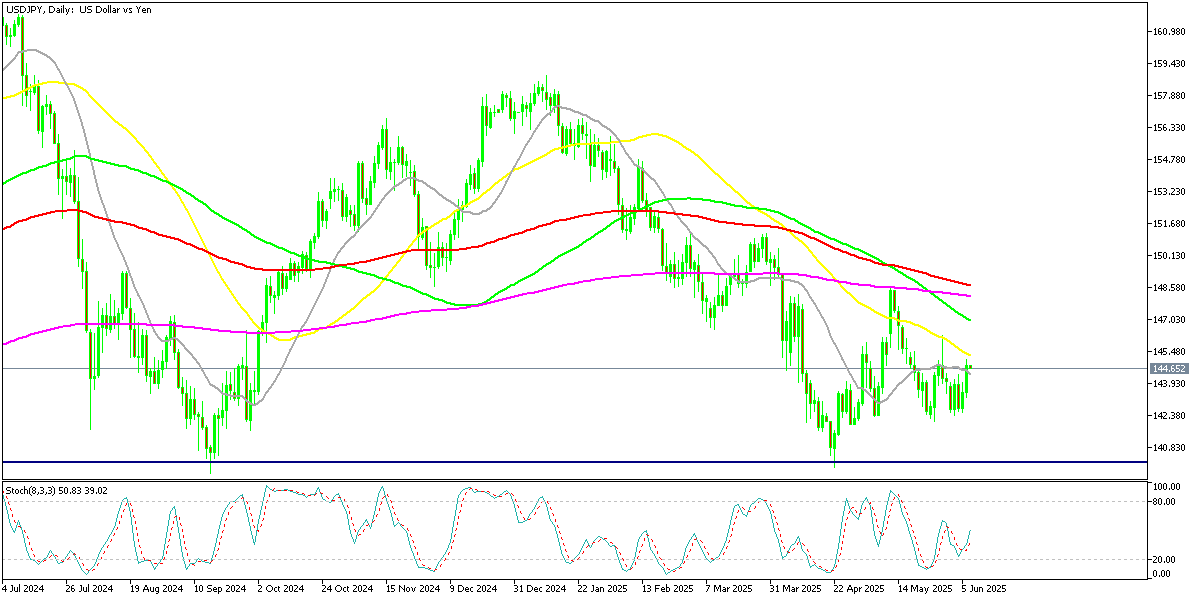
USD/JPY – Daily Chart
Cryptocurrency Update
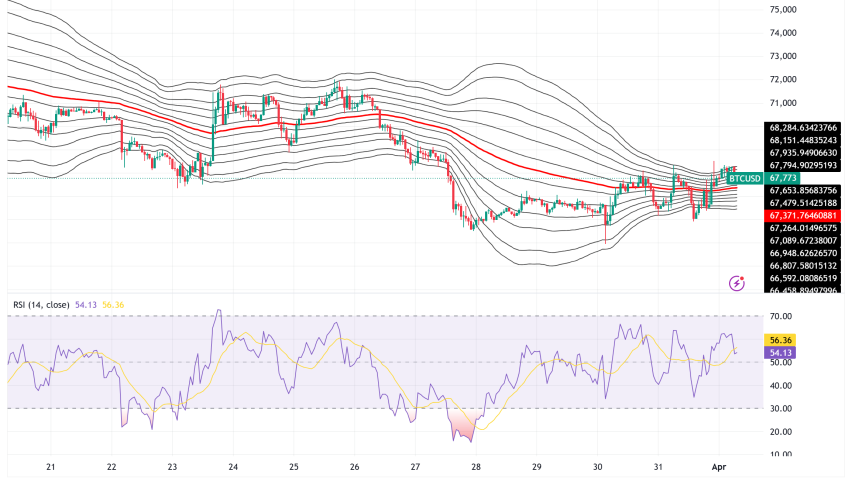
Bitcoin Chart Setup Pints to A New High Soon
Cryptocurrencies are echoing the broader macro narrative. Bitcoin surged past $110,000 earlier in the week, climbing more than 6% over several sessions. Its role as a perceived hedge against U.S. economic instability, ballooning debt, and global tensions continues to attract investors. However, the rally met resistance at the 20-day moving average, and BTC has since retreated to $100,000.
BTC/USD – Daily chart
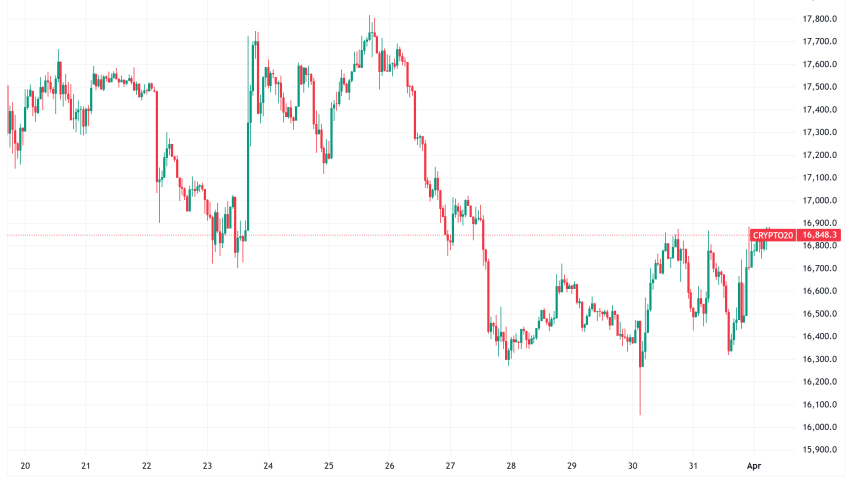
Ethereum Rejected by the MAs
Ethereum also participated in the uptrend, gaining over 20% since April, supported by renewed institutional enthusiasm following the successful rollout of the Pectra upgrade. The enhancement—focused on improving wallet functionality and staking operations—has added both technical momentum and longer-term utility appeal to Ether. Nonetheless, the 200-day SMA remains a key resistance level, with ETH/USD seeing rejection from that threshold in its latest attempt to climb higher.
ETH/USD – Daily Chart
- Check out our free forex signals
- Follow the top economic events on FX Leaders economic calendar
- Trade better, discover more Forex Trading Strategies
- Open a FREE Trading Account
- Read our latest reviews on: Avatrade, Exness, HFM and XM
ABOUT THE AUTHOR
See More
Skerdian Meta
Lead Analyst
Skerdian Meta Lead Analyst.
Skerdian is a professional Forex trader and a market analyst. He has been actively engaged in market analysis for the past 11 years. Before becoming our head analyst, Skerdian served as a trader and market analyst in Saxo Bank's local branch, Aksioner. Skerdian specialized in experimenting with developing models and hands-on trading. Skerdian has a masters degree in finance and investment.
Related Articles
Sidebar rates
Related Posts
