Bitcoin Faces Critical Support Test as Middle East Tensions Trigger Risk-Off Sentiment
Bitcoin (BTC) is currently trading above $103,000, marking a decline of over 3% in the past 24 hours as escalating Middle East tensions
Quick overview
- Bitcoin is currently trading above $103,000, experiencing a decline of over 3% in the past 24 hours due to escalating Middle East tensions.
- The recent Israeli airstrikes have triggered a selloff in risk assets, causing Bitcoin to drop from a high of $108,500.
- Technical analysis indicates potential downside risks for Bitcoin, with critical support levels around $102,000-$103,000 and a bearish fractal pattern emerging.
- Despite short-term volatility, institutional experts maintain a constructive outlook on Bitcoin's long-term value proposition.
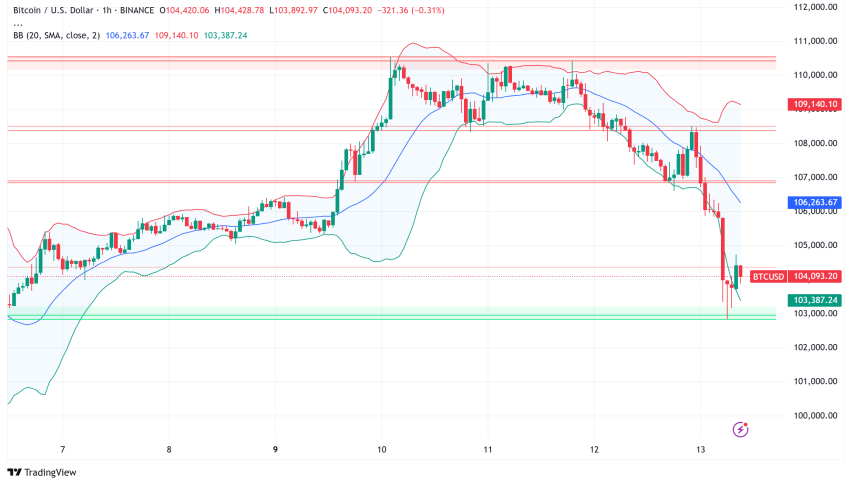
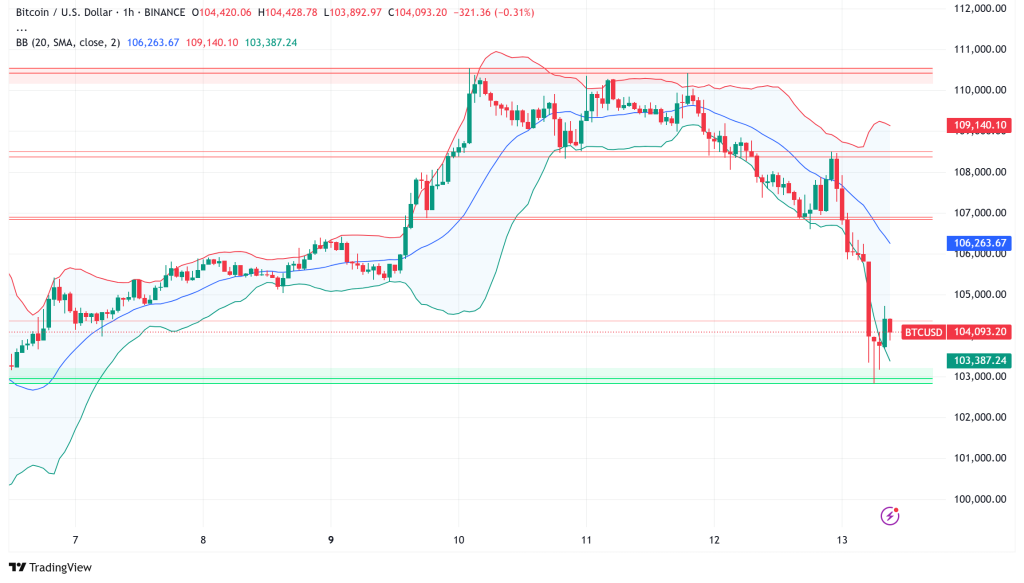
Bitcoin BTC/USD is currently trading above $103,000, marking a decline of over 3% in the past 24 hours as escalating Middle East tensions sparked a broad retreat from risk assets. The world’s largest cryptocurrency has fallen from recent highs near $110,653, testing crucial technical support levels amid geopolitical uncertainty.
Israeli Airstrikes Rattle Global Markets
The most recent selloff happened after Israel bombed Iranian military bases near Tehran and Tabriz on Thursday night. The strikes signaled a big rise in tensions in the area, and Bitcoin fell drastically from a 24-hour high of $108,500 to $103,556. Israeli Prime Minister Benjamin Netanyahu called Iran’s plans to get nuclear weapons a “clear and present danger,” which means that military operations will keep going until the threat is gone.
The geopolitical event caused a typical flight-to-safety trade, with gold going up 1.7% to $2,414 per ounce and all risk assets going down. Futures for U.S. stocks were down as investors thought about the possibility of more regional warfare.
But experienced crypto investors see this as a pattern they know well. Ryan McMillin, chief investment officer at Merkle Tree Capital, said, “Previous flashpoints, like the April 2024 strikes, caused weekend sell-offs across crypto, which then turned around quickly once the situation calmed down.” “Those times turned out to be great times to buy.”
BTC/USD Technical Analysis Reveals Mixed Signals
From a technical point of view, Bitcoin is showing worrying patterns that point to more downside risk. The cryptocurrency has made three bearish candles in a row, wiping out gains from earlier in the week. It is now down about 2% for the week.
Key Technical Levels:
- Current Support: $102,000-$103,000 high-demand zone
- Critical Support: 50-day Exponential Moving Average at $104,458
- Major Support: $100,372 (30-day low)
- Resistance: $105,500-$106,600 zone
The Moving Average Convergence/Divergence (MACD) indicator reveals a failed bullish reversal, and the bearish histograms show that the retreat phase is picking up speed. The Relative Strength Index (RSI) has dipped below the neutral 50 level, which means that bullish momentum is fading and more falls are possible.
Fractal Analysis Points to Potential Bull Trap
Bitcoin bulls should be worried by the appearance of a fractal pattern that looks like the price action from January 2025. The current situation is similar to a past one in which BTC went from $91,700 to $102,700 before falling sharply.
The fractal pattern has three main things in common:
- After staying stable for 3–4 weeks, Bitcoin broke a downward trendline.
- The cryptocurrency did not reach fresh all-time highs.
- After bouncing back from below 50, RSI turned down at the 60 mark.
If this trend continues, Bitcoin might get a strong rejection that could bring prices down to the $100,000 psychological support level. But if Bitcoin can get back over $108,000 and stay there, the pattern will no longer be relevant.
Institutional Perspective Remains Constructive
Even though things are changing quickly in the short term, institutional experts still have a calm view. Jamie Coutts, the chief crypto analyst at Real Vision, said that Bitcoin is still acting as a risk-on/risk-off asset for short-term traders. However, institutional allocators are having more and more of an impact on its medium- to long-term path.
Coutts said, “That’s why it can move with risk assets in the short term but outperform gold in the long term.” He was talking about the developing narrative of institutional adoption that supports Bitcoin’s value proposition.
Kelvin Koh from Spartan Capital agreed with this idea, saying that geopolitical wars usually don’t last long because the stakes are so high in the region. “We think that the market correction is a good time to buy risk assets that have strong fundamentals but have dropped a lot because of the turmoil.”
Bitcoin Price Prediction and Outlook
Technical analysis shows that Bitcoin is at a very important point right now. If the price closes below the 50-day EMA at $104,458 every day, it could go down even more near the $100,372 support level, which is the lowest point in 30 days of trading.
- Bearish Scenario: If the fractal pattern holds and geopolitical tensions stay high, Bitcoin might test the $100,000-$100,500 support zone. This could be a good time for long-term investors to buy.
- Bullish Scenario: If Bitcoin stays above the 50-day EMA and breaks above the $106,600 resistance mark, it might yet rise back to its all-time high of $111,980.
In the next 48 to 72 hours, it will be very important to figure out if this correction is a healthy slowdown in a bull market or the start of a bigger downturn. Many analysts see any big drops as chances for patient investors to buy more crypto as institutions continue to adopt it and the crypto ecosystem as a whole matures.
- Check out our free forex signals
- Follow the top economic events on FX Leaders economic calendar
- Trade better, discover more Forex Trading Strategies
- Open a FREE Trading Account