Ethereum Signals Potential 100% Rally to $5,000 Amid Growing Bearish Headwinds
Ethereum (ETH) is at a turning point right now as technical patterns suggest that the world's second-largest cryptocurrency might go in

Quick overview
- Ethereum (ETH) is currently trading at $2,400, having dropped 1.8% in the last 24 hours, indicating conflicting market signals.
- The AMD model suggests a bullish outlook for ETH, with potential price targets above $5,000 due to institutional accumulation.
- However, technical resistance and whale distribution signal caution, as ETH struggles to break key resistance levels and faces potential downside pressure.
- Investors should monitor whale flows, ETF inflows, and technical levels to gauge Ethereum's next significant price movement.
Ethereum (ETH) is at a turning point right now as technical patterns suggest that the world’s second-largest cryptocurrency might go in quite different directions. ETH/USD is currently trading at $2,400, yet it has dropped 1.8% in the last 24 hours. This makes it a great example of how conflicting market signals might affect its path for the rest of 2024.

Institutional Accumulation Pattern Points to Explosive Upside
The AMD (Accumulation, Manipulation, Distribution) model, which is a classic “Power of 3” formation, is the most bullish story for Ethereum. After months of consolidation between May 9 and June 20, there was a major trend change between $2,100 and $2,200. This led to the rise of this institutional trading pattern.
The three phases of the pattern convey a very interesting tale about how institutions are positioned. at the accumulation phase, there was quiet sideways movement as smart money built up positions at times of low volatility. Then came manipulation: a quick drop below $2,200 to scare regular investors into selling before the price shot back up dramatically. ETH is now in the distribution phase, and it has bounced back to $2,500. Institutional demand validation came from spot ETH ETF inflows of 106,000 ETH last week, which was the seventh week in a row of positive flows.
Thomas Lee, the new head of Bitmine, has compared this situation to Ethereum’s historic rally from 2016 to 2017. He says that ETH could be on the cusp of its “most hated rally,” which is a rise that few people expect but is caused by institutional positioning. The price target for the pattern is above $5,000, which means it may go up 100% from where it is now.
ETH Technical Resistance and Whale Distribution Signal Caution
But there are also strong bearish factors at work. Ethereum is having a hard time technically since it hasn’t been able to break through long-standing resistance levels and has slipped below the lower boundary of a multi-year symmetrical triangle on the two-week chart. This breakdown might lead to a drop of up to 25% to $1,600.
The latest activity of whales is more worrying because they moved almost $237 million worth of ETH from staking to exchanges. Over the course of five days, more than 62,000 ETH has already entered Binance. This suggests that significant holders are selling more and moving their coins to mid-tier wallets.
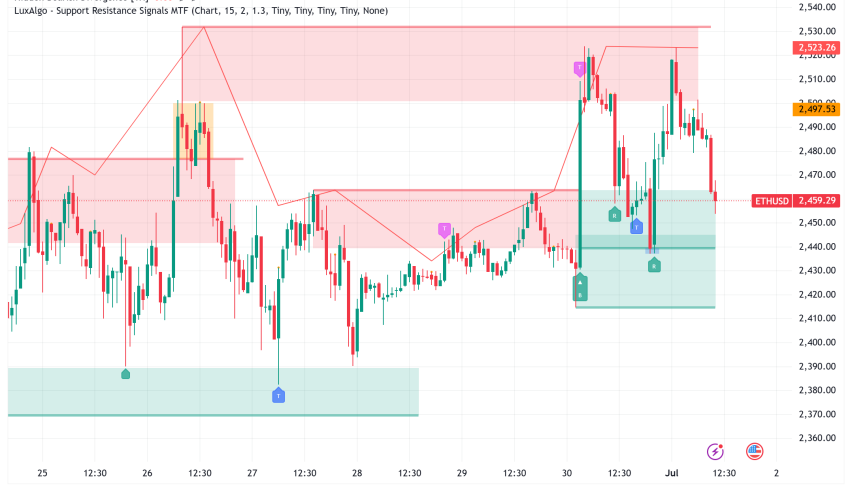
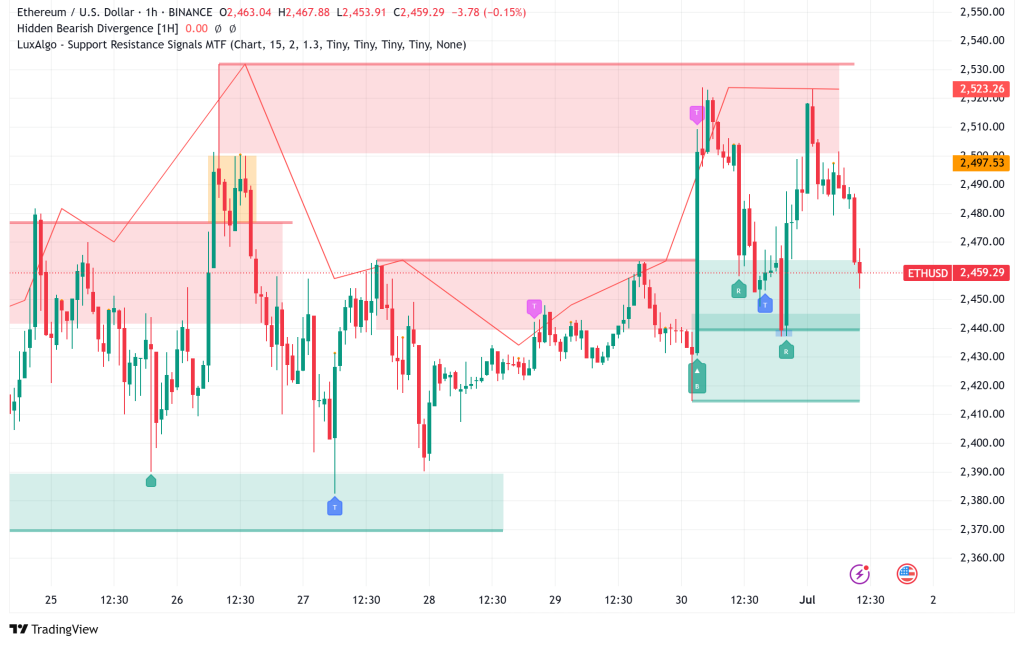
Short-term technical indicators are showing symptoms of trouble. Crypto trader exitpump says that ETH is having trouble at the $2,500 resistance level and that open interest is rising while prices are falling, which is a bearish divergence. Negative short-term funding rates and lower spot activity are more signs of developing downside pressure, with important support levels between $2,350 and $2,275.
Market Dynamics Reveal Divergent Investor Behavior
The bigger picture of the market makes things much more complicated. Bitcoin gets a lot of retail FOMO, with the short-term holder Net Position Realized Cap going from negative $49 billion to over $5 billion. Ethereum, on the other hand, has different characteristics. Long-term investors keep buying more during priceistrate price consolidation, showing that impatient capital is increasing positions even though prices are low right now.
The difference between how people buy Bitcoin and how institutions buy Ethereum could be very important. In the past, retail FOMO has generally happened near market tops, whereas institutional stockpiling has usually happened before big swings.
Ethereum Price Prediction and Near-Term Outlook
Based on current technical analysis, Ethereum faces two distinct scenarios over the next 3-6 months:
- Bullish Case: If the Power of 3 pattern plays out and ETH maintains support above $2,400, initial targets sit at $2,680-$2,750, with the ultimate goal of $5,000 representing a 100% gain. Key resistance levels to watch include $2,520, $2,600, and $2,680.
- Bearish Case: Failure to hold current support could trigger the 25% correction toward $1,600, with intermediate support at $2,350-$2,275 providing potential bounce levels.
The near-term catalyst will likely be ETH’s ability to reclaim and hold above $2,500-$2,520 resistance. A decisive break higher could initiate the institutional-driven rally, while failure could validate the bearish symmetrical triangle breakdown.
Changes in U.S. policy and macro conditions will obviously affect how people feel about crypto, but Ethereum’s technical setup says that the next big move, whether it’s up 100% or down 25%, might happen soon. Investors should keep an eye on whale exchange flows, ETF inflows, and important technical levels to get an idea of which way Ethereum’s price is going to move at this important time.
- Check out our free forex signals
- Follow the top economic events on FX Leaders economic calendar
- Trade better, discover more Forex Trading Strategies
- Open a FREE Trading Account


