Zeta Global (ZETA) Stock Rebounds Sharply After Prolonged Correction

Quick overview
- Zeta Global Holdings Corp. (NYSE: ZETA) is experiencing a rebound after an eight-month correction, having lost 72% of its market value since November 2024.
- The stock is currently testing critical resistance at the 50-week EMA around $16.64, which could determine the direction of future price movements.
- Momentum indicators show mixed signals, with the MACD histogram rising but the RSI remaining neutral, indicating caution in confirming a trend shift.
- ZETA is at a pivotal point with multiple support levels in play, and a potential relief rally could occur if the current support zone holds.
Zeta Global Holdings Corp. (NYSE: ZETA) is a leading AI-driven marketing tech firm focused on data-powered customer acquisition and engagement. After an eight-month correction, the stock is now showing signs of a strong rebound.
Zeta Global (ZETA) Technical Breakdown: Signs of Reversal After Brutal Drawdown
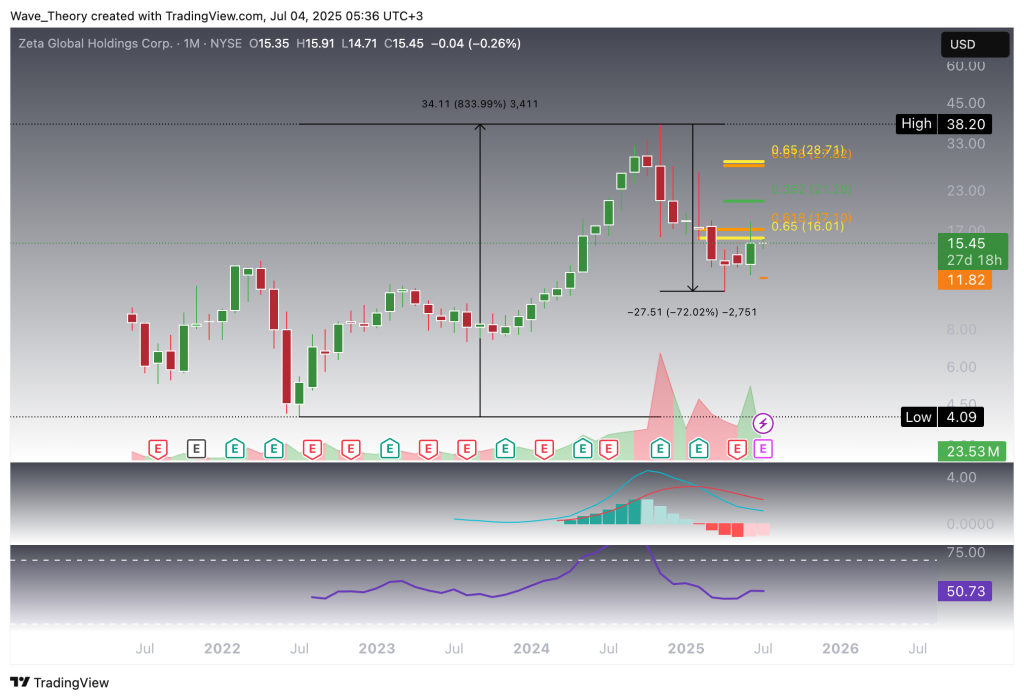
Zeta Global (NYSE: ZETA) has shed 72% of its market value since its November 2024 peak, marking a steep seven-month correction. This drawdown follows a remarkable 834% rally over the preceding three years — a classic parabolic move now undergoing structural reversion.
Technically, momentum indicators are beginning to signal early-stage recovery. The MACD histogram has been ticking bullishly higher since last month, though the MACD lines remain bearishly crossed, suggesting caution in calling a confirmed trend shift. Meanwhile, the RSI remains directionless, hovering in neutral territory without offering a clear bias.
Notably, price action over the past month reflects a potential bottoming pattern, with ZETA rebounding over 50%. The rally now approaches a critical resistance zone at the $16 level, aligning with the golden Fibonacci ratio and a previously broken structural support — a key inflection point for bulls and bears alike.
ZETA Stock Confronts Critical Resistance at 50-Week EMA — Eyes Set on Fibonacci Targets
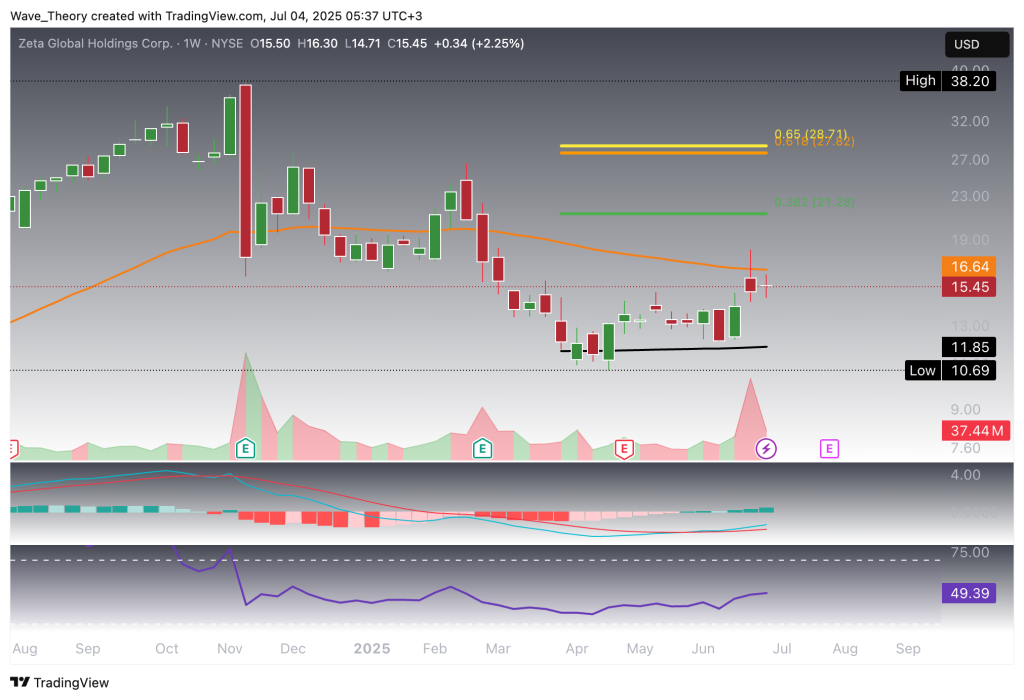
Zeta Global (ZETA) is currently testing major resistance at the 50-week Exponential Moving Average (EMA), situated at $16.64 — a level that has historically acted as a dynamic barrier in broader trend cycles. A bullish breakout above this zone could open the path toward the 0.382 Fibonacci retracement at $21.30, followed by the golden ratio resistance at $28.50.
Momentum indicators continue to strengthen. The MACD histogram has been rising steadily for three consecutive months, and the MACD lines have now crossed bullishly, reinforcing positive momentum. Additionally, the EMAs remain in a golden crossover configuration, signaling a sustained mid-term bullish trend.
However, the RSI remains neutral, offering no clear directional bias at this stage — suggesting that price action at the $16.64 level will be pivotal in confirming whether the current rally has further legs.
Where Does ZETA Stock Find Support? Key Levels to Watch Amid Ongoing Pullback
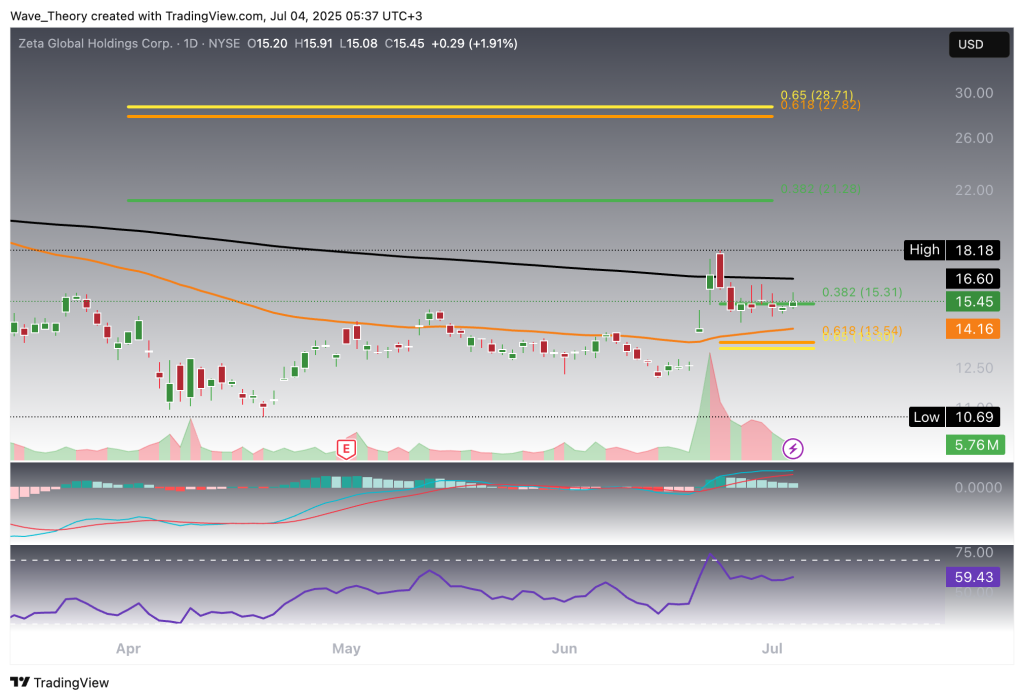
Zeta Global (ZETA) has entered a short-term correction over the past few days, now testing support at the 0.382 Fibonacci retracement level at $15.31. If this level fails to hold, the next significant downside target lies at the 0.5 Fib support near $13.50. Additionally, the 50-day EMA at $14.16 offers dynamic support and could act as a cushion during further weakness.
On the momentum side, the MACD histogram has been ticking lower, suggesting growing bearish pressure, while the MACD lines are nearing a potential bearish crossover. Furthermore, the daily EMAs have formed a death cross, confirming a short- to mid-term bearish bias. Meanwhile, the RSI remains in neutral territory, offering no immediate reversal signal.
Taken together, ZETA sits at a technically significant juncture, with multiple support levels in play and momentum turning cautious.
ZETA 4H Chart: Bearish Structure Intact, but Support May Trigger Short-Term Rebound
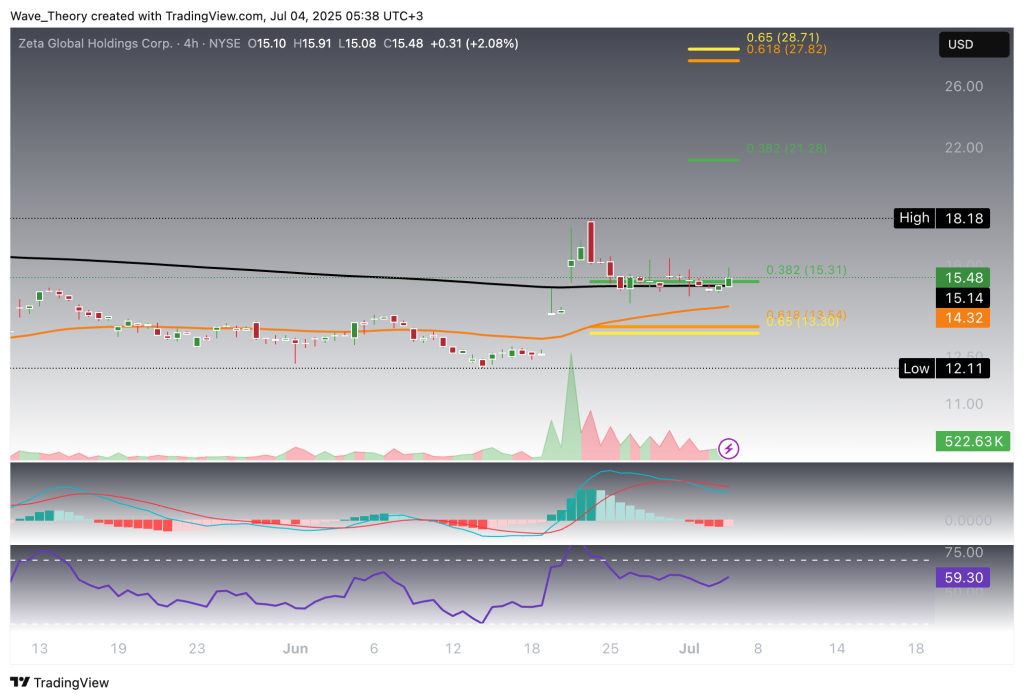
On the 4-hour chart, ZETA maintains a bearish short-term structure, with the EMAs displaying a death cross and the MACD lines crossing bearishly, both reinforcing downward momentum. The MACD histogram, however, has been fluctuating between bullish and bearish ticks, suggesting market indecision. Meanwhile, the RSI remains in neutral territory, providing no immediate directional signal.
That said, if the current support zone holds, ZETA could stage a relief rally toward the recent swing high at $18.18, and potentially extend the move toward the Fibonacci resistance at $21.30, before encountering stronger resistance and risk of a renewed correction.
- Check out our free forex signals
- Follow the top economic events on FX Leaders economic calendar
- Trade better, discover more Forex Trading Strategies
- Open a FREE Trading Account
- Read our latest reviews on: Avatrade, Exness, HFM and XM
Related Articles
Sidebar rates
