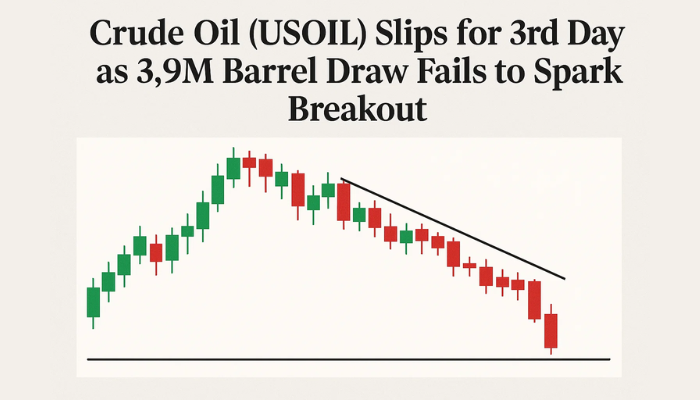
Crude Oil (USOIL) Slips for 3rd Day as 3.9M Barrel Draw Fails to Spark Breakout
WTI crude fell for a third day on Wednesday, dropping below $67 as the latest US inventory data showed a bigger than expected drawdown.
Quick overview
- WTI crude prices fell below $67 for the third consecutive day due to a larger than expected drawdown in US inventory data.
- OPEC+ continues to increase production, which is balancing out summer demand and keeping prices stable.
- Technical indicators suggest caution, with WTI consolidating between $65.43 and $67.01 and resistance at $67.17.
- The RSI indicates market hesitation, with no strong momentum from either buyers or sellers.
WTI crude fell for a third day on Wednesday, dropping below $67 as the latest US inventory data showed a bigger than expected drawdown. According to the Energy Information Administration (EIA), commercial crude stockpiles fell 3.9 million barrels last week—way more than the one million barrel draw analysts were expecting.
But the bullish surprise was overshadowed by the bigger picture. OPEC+ is still ramping up production, adding 411,000 barrels per day (bpd) since May and 548,000 bpd in August. That’s balanced out the usual summer demand and keeps prices in a tight range.
Despite the supportive inventory data, there’s no price breakout so the market is still cautious waiting for more signals from economic data or supply developments.
WTI Technicals Say Be Cautious Below $67
From a technical perspective, WTI crude is consolidating between $65.43 and $67.01 after failing to reclaim the $68.28 resistance zone. The recent slide from $70 broke the bullish channel and confused traders.
Adding to the bearish bias is the 50-period Simple Moving Average (SMA) at $67.17 which has turned from support to resistance. Price has failed to close above this dynamic level multiple times, indicating bulls are running out of steam.
A developing downward sloping channel, with lower highs and lower lows, confirms the lack of upward momentum. $65.43 is still the lower band of support. If broken, it could lead to a test of $64.32.
RSI is Neutral-to-Bearish
The 14-period Relative Strength Index (RSI) is at 44.37—below 50 but above 40. This shows no strong conviction from either side.
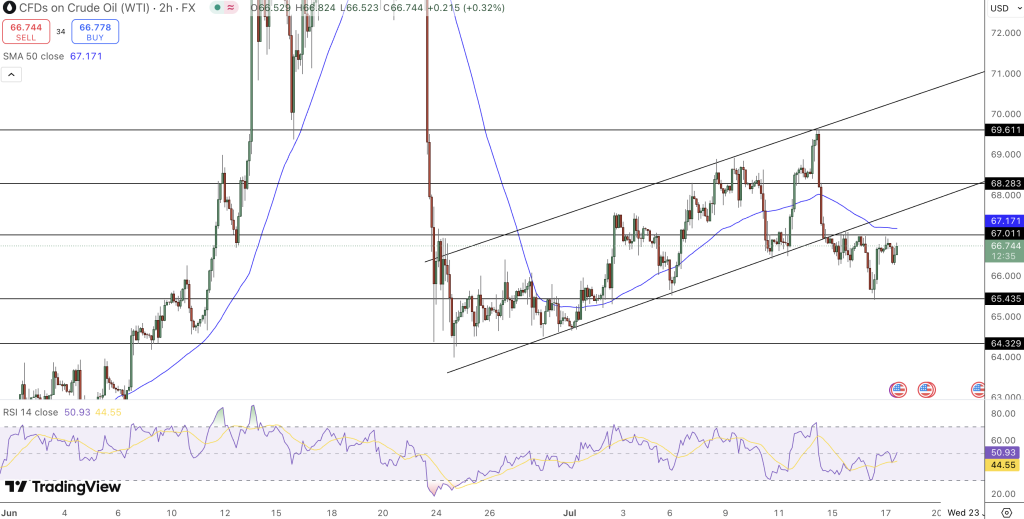
RSI has failed to move above the midline which typically means weak bullish momentum. There’s no significant divergence between price and RSI for now. A break below 40 could mean accelerating downside. A move above 50 would be the first sign bulls are back in control.
Levels to Watch:
- Resistance: $67.17, $68.28, $69.61
- Support: $65.43, $64.32
Conclusion
A bullish inventory number but crude oil is still stuck in consolidation mode and can’t break above resistance or get back in trend. OPEC+ production and technicals are capping gains. RSI is showing market hesitation, so be nimble. A close above $67.20 or below $65.40 will be the next directional move.
- Check out our free forex signals
- Follow the top economic events on FX Leaders economic calendar
- Trade better, discover more Forex Trading Strategies
- Open a FREE Trading Account