PayPal (PYPL) Stock Analysis: Is a Bullish Reversal Finally Underway?

Quick overview
- PayPal (PYPL) is currently trading over 76% below its 2021 all-time high and has been in a long-term downtrend since July 2021.
- Despite a recent recovery phase, technical signals indicate that the rebound is fragile, with bearish momentum and mixed indicators.
- The stock is testing key support levels, and a decisive break below these could lead to further downside, while a bullish crossover in the daily EMAs may signal a potential shift in trend.
- Year-to-date, PYPL is down approximately 20%, highlighting its underperformance compared to broader tech benchmarks.
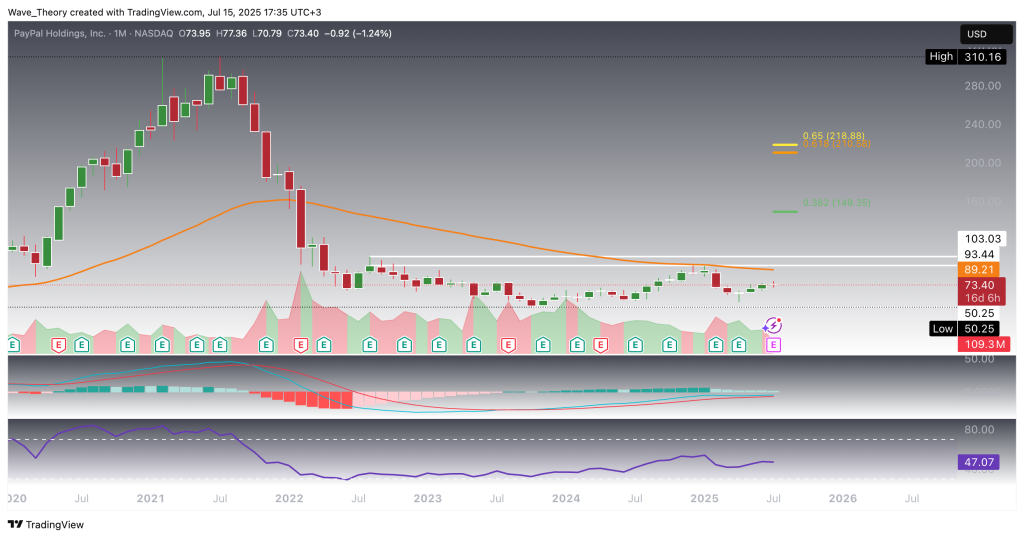
PayPal (PYPL) remains under significant long-term pressure, currently trading over 76% below its 2021 all-time high. The stock has been in a multi-year downtrend since July 2021, culminating in a local bottom in October 2023. From there, it entered a recovery phase, but broader technical signals suggest this rebound remains structurally fragile.
PayPal (PYPL) Stock Shows A Bearish Trend
The initial recovery leg peaked in January 2025, precisely at the 50-month EMA, which acted as a dynamic resistance level around $89.21. That test resulted in a decisive bearish rejection, leading to a retracement down to the $56 support region — a key area where buyers re-entered and stabilized price action.
Since that low, PYPL has been trending higher for the past three months, but this current upswing is beginning to show signs of exhaustion. This month, bullish momentum is visibly weakening, raising caution for continuation traders.
From a momentum perspective:
-
The MACD histogram continues to print bearish, indicating underlying trend weakness, even though the MACD lines remain in a bullish crossover — a mixed signal that reflects a tug-of-war between short-term buyers and longer-term sellers.
-
The RSI sits in a neutral zone, offering no clear directional bias at present.
On a year-to-date basis, PYPL is down approximately 20%, underscoring its underperformance relative to broader tech benchmarks.
In summary, while PayPal has managed a technical rebound off multi-year lows, the rejection at the 50-month EMA and the recent momentum deceleration suggest that the recovery remains vulnerable, and confirmation of trend continuation remains absent. Traders should closely monitor support levels and watch for any breakdown in momentum indicators to reassess directional bias.
PayPal (PYPL) – Weekly Chart: Correction Targets & Technical Structure
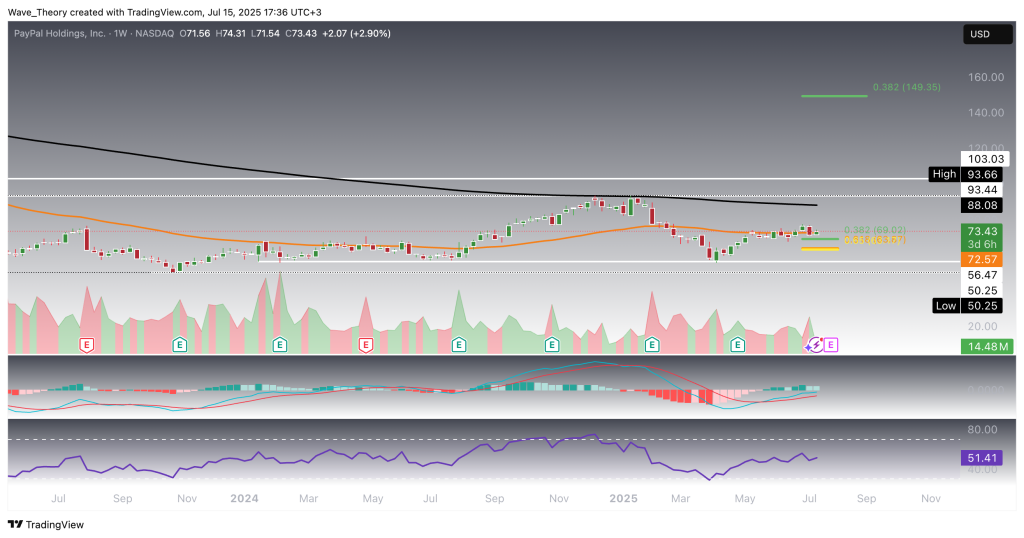
PayPal (PYPL) continues to trade within a corrective structure, with the weekly chart confirming a bearish mid-term trend. A death cross formation between the 50-week and 200-week EMAs reinforces bearish pressure, while the MACD histogram has started to tick lower, signaling renewed downside momentum. Notably, the MACD lines remain in a bullish crossover, reflecting residual strength from the prior rebound phase. The RSI remains neutral, providing no clear directional signal at this stage.
Currently, PYPL is testing support at the 50-week EMA near $72.60. A decisive break below this level would likely open the door for further downside towards the Fibonacci support levels at $69 and $63, respectively — both key zones to watch for potential buyer re-entry.
On the upside, any bullish reaction would face its next major resistance at the 200-week EMA, currently situated around $88. A weekly close above this level would be required to shift the mid-term technical outlook back toward neutral-to-bullish.
PayPal (PYPL) – Daily Chart: A Potential Golden Crossover in Sight
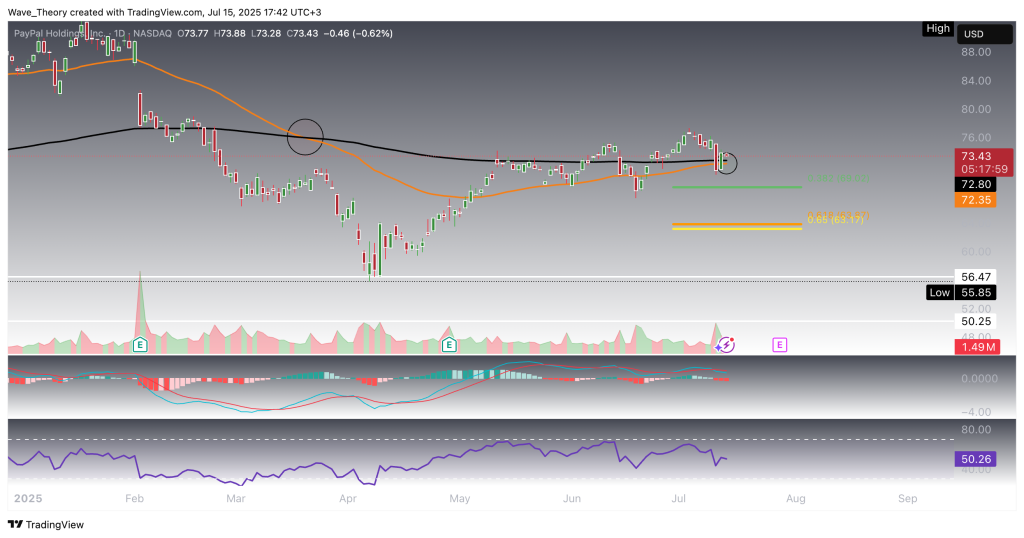
On the daily timeframe, momentum remains mixed with a bearish crossover in the MACD lines and a MACD histogram that continues to tick lower, indicating short-term downside pressure. The RSI is tracking within neutral territory, offering no clear momentum bias.
However, price action is approaching a key technical juncture: the daily EMAs are nearing a potential golden crossover, where the 50-day EMA could cross above the 200-day EMA. If confirmed, this would signal a bullish shift in the short- to medium-term trend, despite current weakness in momentum indicators.
Conclusion: While the current momentum backdrop remains soft, the potential for a golden EMA crossover adds a constructive undertone to the daily structure. A confirmation of this crossover could attract fresh bullish interest, provided support levels hold in the near term.
PayPal (PYPL) – 4H Chart: Bullish Confirmation
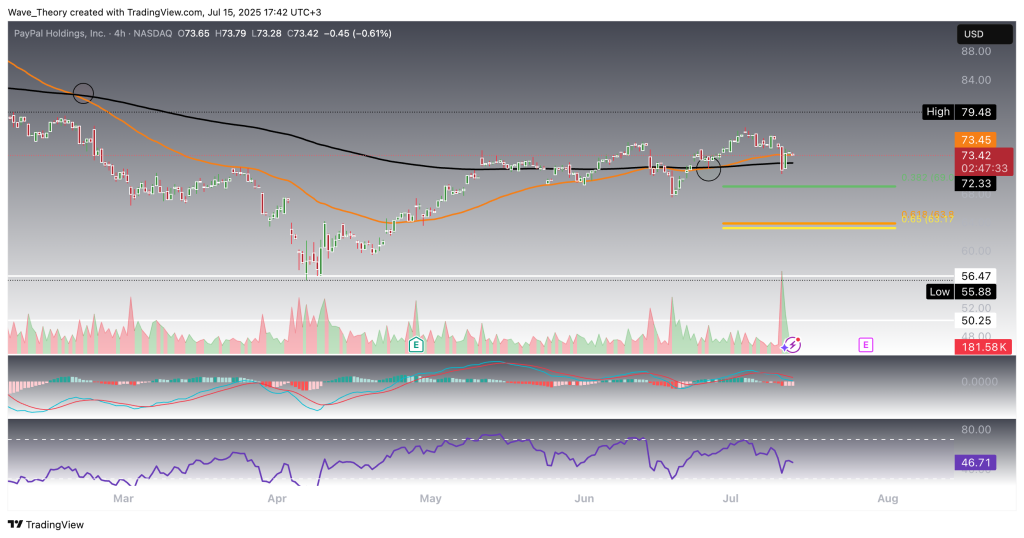
On the 4-hour chart, PayPal has confirmed a short-term bullish trend with a completed golden crossover of the EMAs — a technical signal suggesting upward momentum is gaining traction. Supporting this, the MACD histogram is currently ticking higher, indicating strengthening bullish pressure beneath the surface.
However, this move is not yet fully confirmed across all indicators: the MACD lines remain bearishly crossed, and the RSI continues to hover in neutral territory, reflecting a market still in transition.
Conclusion: There is further upside, with key resistances at $88 and $89. Should the PYPL stock fail to breakout bullishly, it could retrace down to the Fib support levels at $69 and $63.
- Check out our free forex signals
- Follow the top economic events on FX Leaders economic calendar
- Trade better, discover more Forex Trading Strategies
- Open a FREE Trading Account
- Read our latest reviews on: Avatrade, Exness, HFM and XM
Related Articles


Sidebar rates
Related Posts
